Debugging with PhpStorm
Download the Xdebug extension compatible with your PHP version and install it as described in the Xdebug installation guide.
If you are using a preconfigured AMP (Apache, MySQL, PHP) package, the Xdebug extension may be already installed. Refer to the instructions specific for your package.
Edit the relevant php.ini file to integrate Xdebug with the PHP engine:
Disable the Zend Debugger and Zend Optimizer tools which block Xdebug. To do so, remove or comment out the following lines in the php.ini file:
zend_extension=<path_to_zend_debugger>
zend_extension=<path_to_zend_optimizer>
Enable Xdebug. To do so, locate or create the
[xdebug]section in the php.ini file and update it as follows:[xdebug] zend_extension=xdebug xdebug.mode=debug xdebug.client_host=localhost xdebug.client_port=9003zend_extension: the setting indicating that the Xdebug debugging engine shall be used. Set toxdebugor use the full path to thexdebug.sofile, such as/usr/lib/php/20190902/xdebug.so.xdebug.mode: the setting controlling which Xdebug features are enabled. Set todebugfor debugging.xdebug.client_host: the IP address or hostname at which PhpStorm is running and listening for incoming connections from Xdebug. For example,localhostor127.0.0.1if Xdebug and PhpStorm run on the same machine. Xdebug only supports connecting to a single IP address, however, you can use a DBGp proxy to debug PHP applications in multiuser environments.xdebug.client_port: the port to which Xdebug tries to connect on the host where PhpStorm runs. The default port is9003.
Verify Xdebug installation by doing any of the following:
In the command line, run the following command:
php --versionThe output should list Xdebug among the installed extensions:

Create a php file containing the following code:
<?php
phpinfo();
Open the file in the browser. The
phpinfooutput should contain the Xdebug section:
Use PhpStorm ( in the main menu) to validate the installation and configuration of Xdebug on your web server and get suggestions for fixing the inconsistencies if there are any. For details, see Validate the configuration of a debugging engine.

Choose and install the browser extension suitable for your browser — for example, Xdebug Helper by JetBrains for Chrome.
For more options and details, see Browser debugging extensions.
Open the application URL in the browser and activate the browser extension.

Check that the Debug port setting in corresponds to the port configured on the debbuger side. The defualt value is
9003.Additionally, you can customize other Xdebug settings in PhpStorm as described in define Xdebug behaviour.
On the PhpStorm toolbar, toggle
 to start listening for incoming PHP debug connections, or choose from the main menu.
note
With a remote web server, there is a chance that a firewall, router or ISP will be blocking direct connection from your remote server to the port on the local machine where PhpStorm runs. If a direct connection cannot be established, follow the Remote debugging via SSH tunnel procedure.
To test direct connection, on the remote server, run the
telnet host 9003command, wherehostis the IP address of the local machine PhpStorm is running on. To check for opened inbound ports, you can use canyouseeme.org or a similar service.
Open the application development project in PhpStorm and set a breakpoint in code. Breakpoints can be set in the PHP context inside PHP, HTML, TWIG, BLADE, and files of other types.
Line breakpoints can be set by clicking the gutter at the executable line of code.

Conditional breakpoints are hit only when the specified condition, such as a specific item in the loop, is met. To specify a condition, set a line breakpoint and right-click it to open the breakpoint settings dialog.

With exception breakpoints, the debugger suspends execution of the application code when an exception or an error is thrown or when a PHP notice or warning is emitted. To set an exception breakpoint, see Debug with PHP exception breakpoints.

Alternatively, select to have the debugger stop as soon as connection with PhpStorm is established (instead of running automatically until the first breakpoint is reached).
Back in the browser, reload the application page to start the debugging session and return to PhpStorm.
As soon as PhpStorm detects a new incoming connection from Xdebug, it displays an Incoming Connection From Xdebug dialog.

In the Incoming Connection From Xdebug dialog, select the path mappings so that PhpStorm can map the remote files on the web server to the local files in your project. If you have a deployment configuration defined, PhpStorm will offer configuring the mappings based on the paths you've already set in that configuration.
tip
You can also configure path mappings manually in Settings (CtrlAlt0S) | PHP | Servers. For details, see Define a debug server configuration manually.
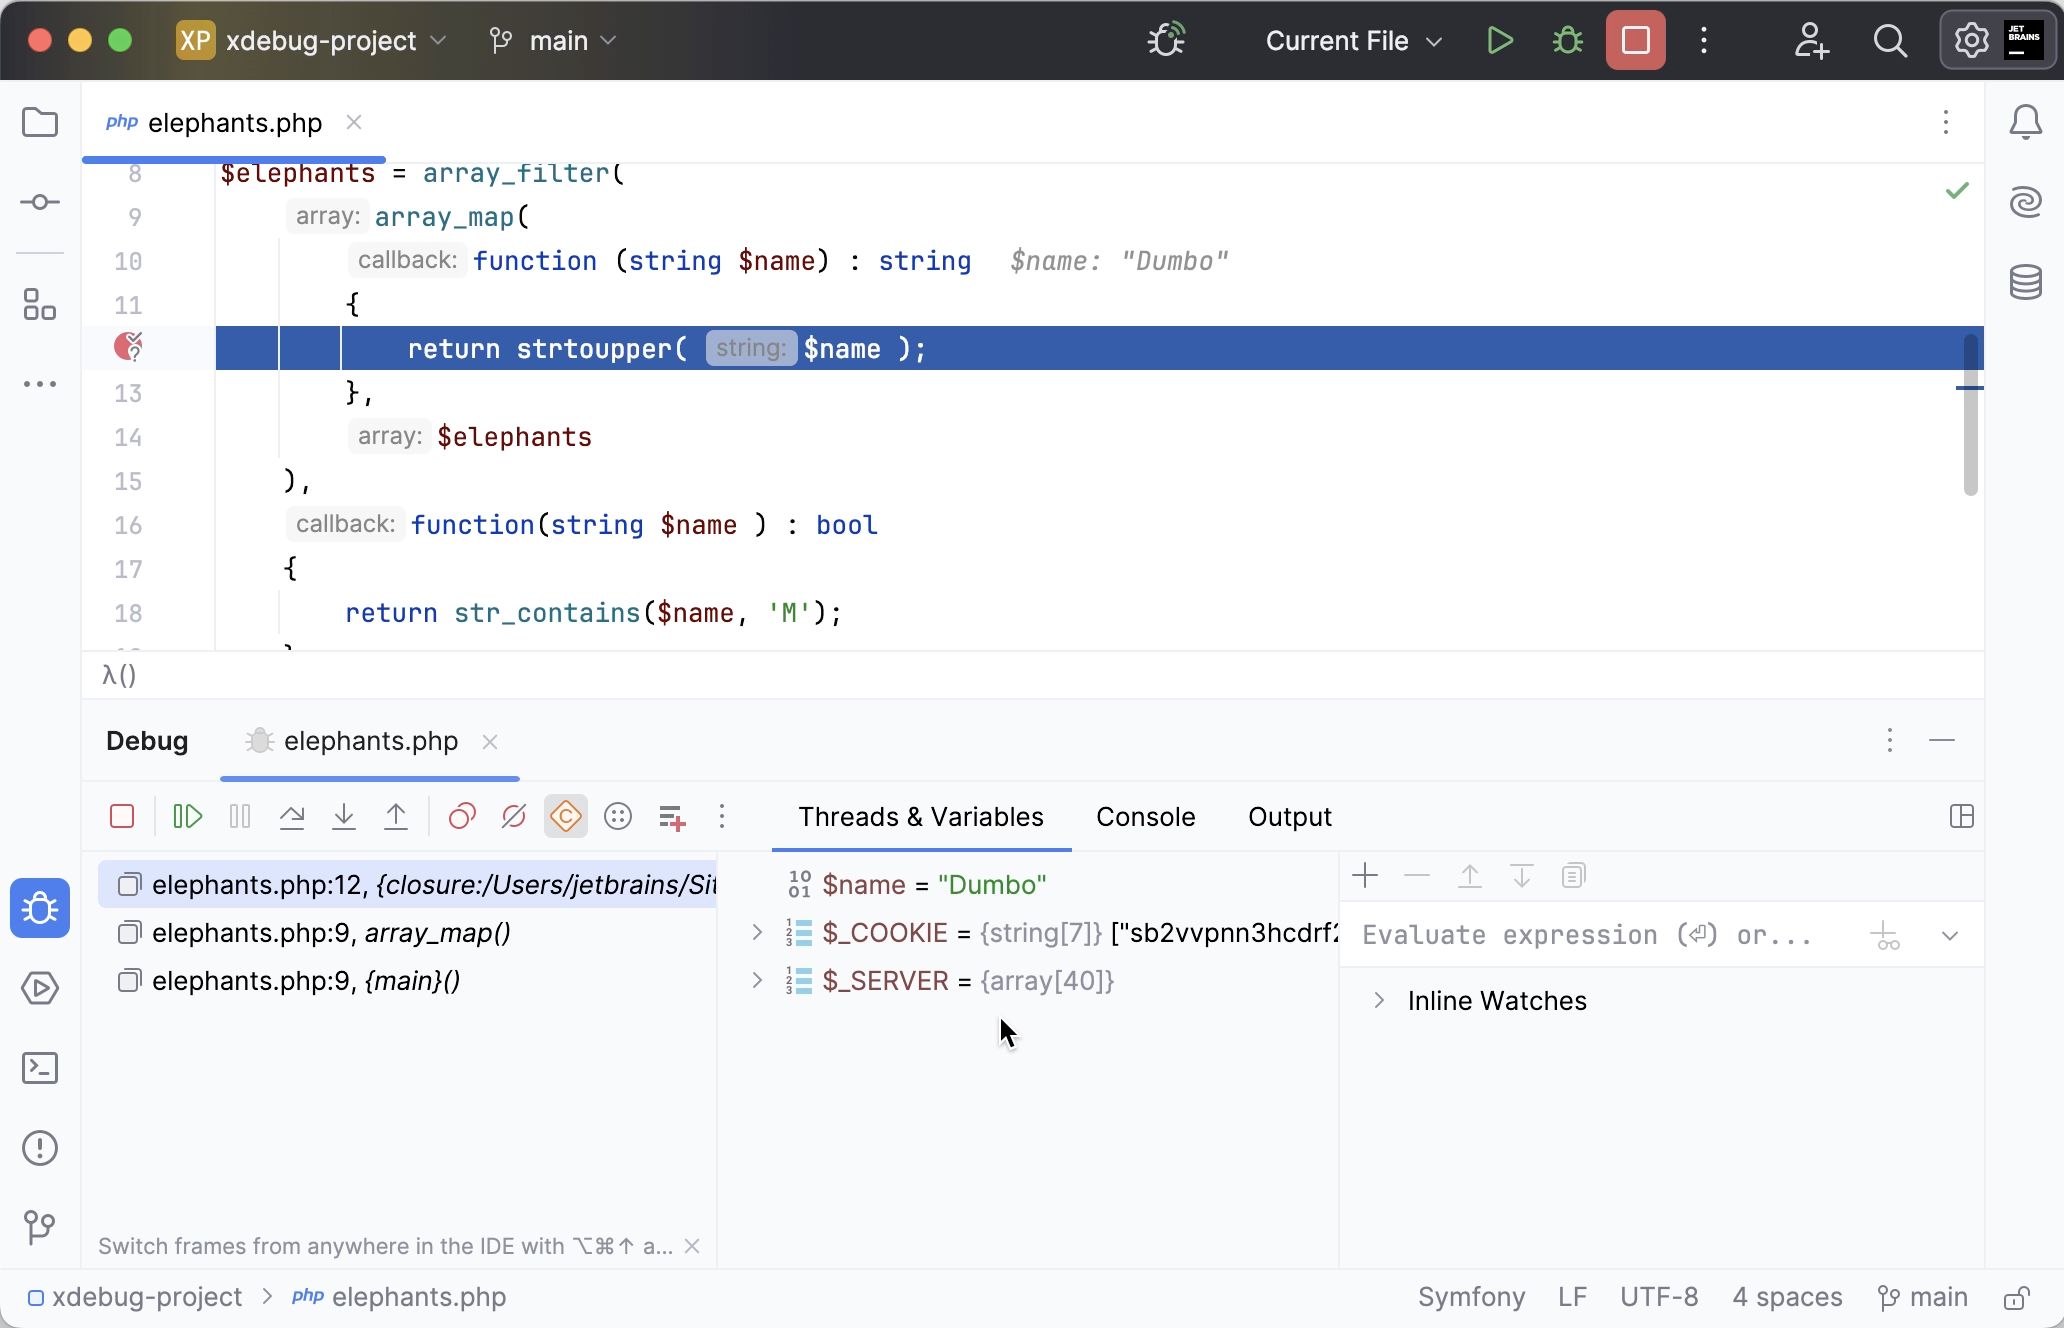
After reaching the breakpoint, the debugger is suspended. You can now investigate the application in PhpStorm's Debug tool window.

For more information about examining the program data (frames, variables, and so on), see Examine a suspended program.
Continue running the program and examine its frames as soon as it is suspended again.
To control the program execution manually, step through the code using the commands under the Run menu or toolbar buttons: F7, ShiftF8, F8, and others. For more information, refer to Step through the program.
To have the program run automatically up to the next breakpoint, resume the session by choosing or pressing F9.
Thanks for your feedback!