View code coverage results
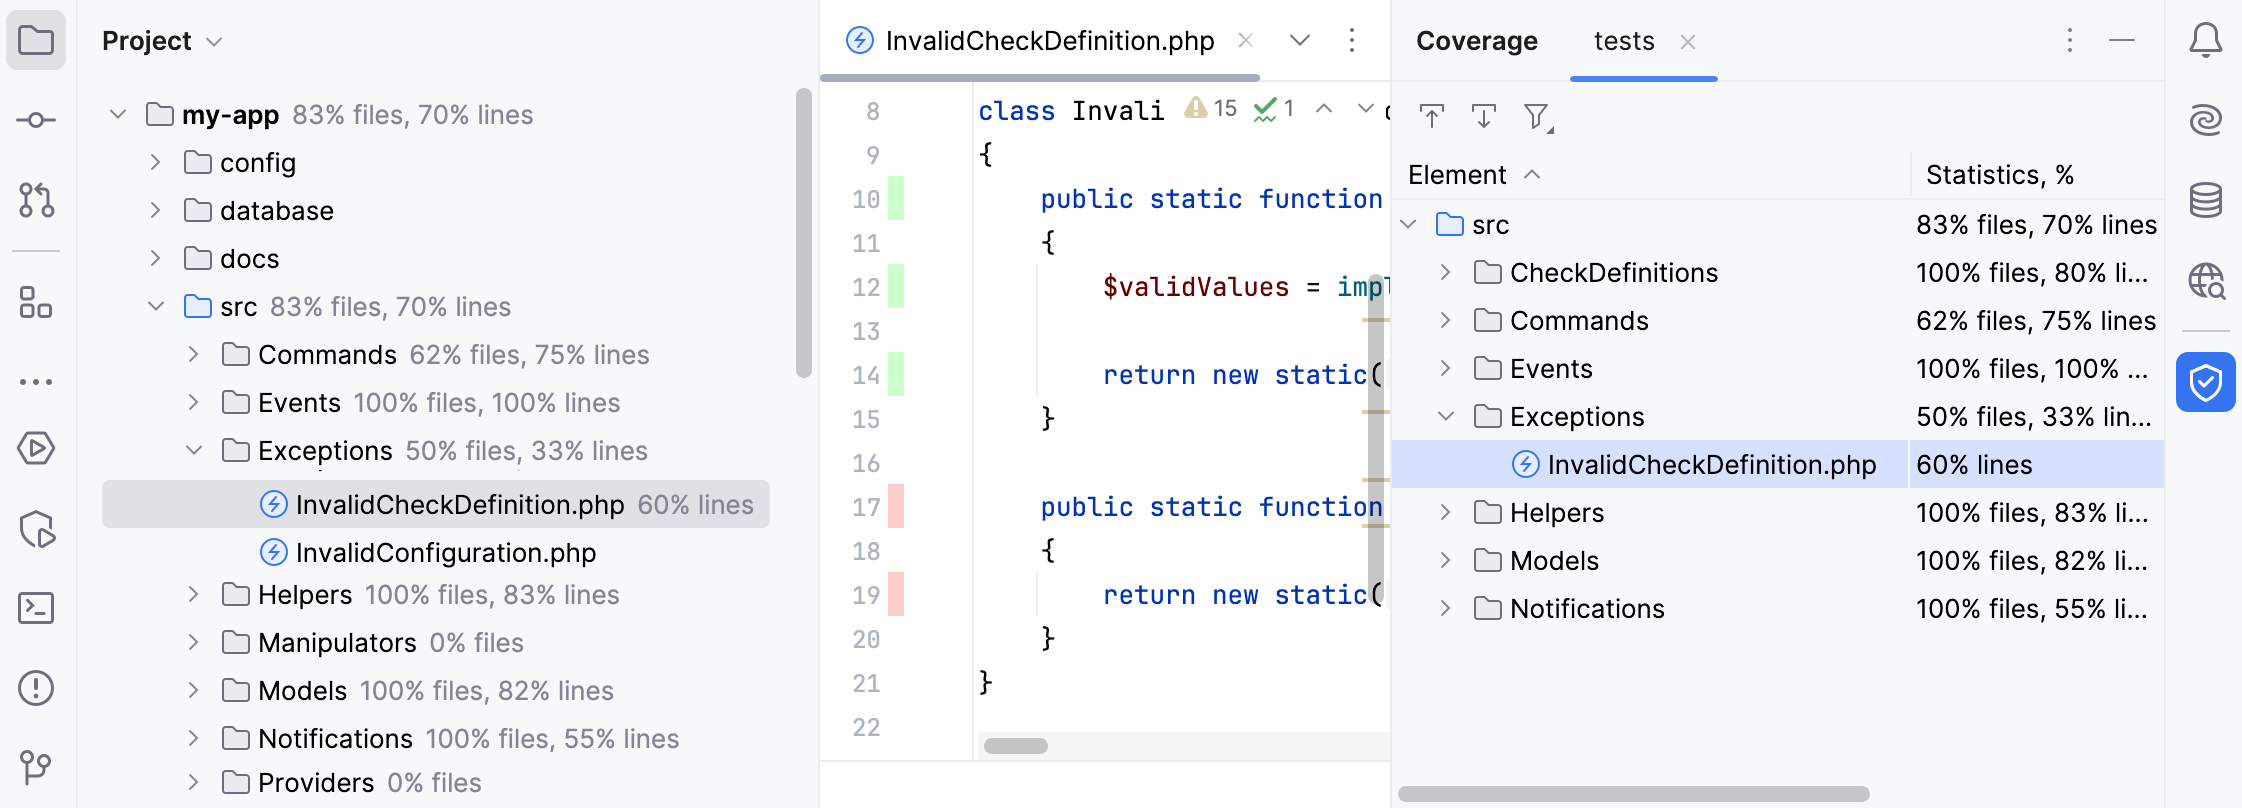
Code coverage results are displayed in the Coverage tool window, in the Project tool window, and in the editor after you run at least one test configuration with coverage.

Additionally, these results are saved to the coverage folder in the IDE system directory.
The Coverage tool window opens right after you run a test configuration with coverage. The report shows:
For a directory: the percentage of the covered files and lines.
For a file: the percentage of the covered lines.
The Coverage tool window has the following options:
Item | Description |
|---|---|
If this option is on, PhpStorm automatically opens the selected item in the editor. Otherwise, you need to double-click items to open them. | |
If this option is on, PhpStorm automatically locates in the tool window the files that you open in the editor. | |
Import a coverage suite from disk. | |
Filter coverage results. You can choose to view only the classes with uncommitted changes to focus on recent updates or hide the classes that are fully covered with tests. |
If you want to reopen the Coverage tool window, go to Run | Show Code Coverage Data in the main menu, or press .
The Project tool window shows:
For a directory: the percentage of the covered files and lines.
For a file: the percentage of the covered lines.
In the editor, lines of code are coloured in the gutter according to their code coverage status:
 Green – lines that have been executed
 Red – lines that have not been executed
To find out how many times a specific code line has been run, or hide coverage results from the editor, click its gutter color indicator.
