Garbage Collection
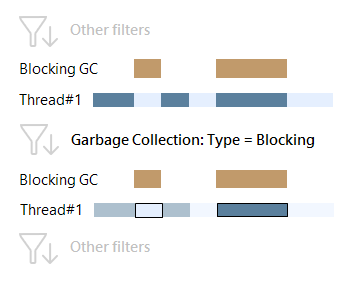
The Garbage Collection filter is used to analyze garbage collections (GC) by filtering time intervals where GC was performed.
To understand how the Garbage Collection filter works, you should be acquainted with basic GC concepts.
Garbage collection concepts in brief
For desktop applications, .NET Framework offers a so-called workstation GC mode.
There are two types of workstation garbage collection: foreground and background.
To perform a foreground GC, garbage collector suspends all managed threads except the one that triggered the collection. This suspends the main thread as well and leads to a UI freeze. This is a "pure" blocking GC.
Background GC is performed by a separate GC thread and does not suspend managed threads during the "heaviest" Gen2 collections. Nevertheless, during Gen0 and Gen1 collections managed threads have to be suspended. Thus, background GC still involves short "blocking GC" intervals. By default, background GC is turned on.
For server applications, there is a special server GC mode. The main difference comparing to workstation GC is that in the server GC mode each logical processor has its own managed heap and a separate GC thread. From the point of performance analysis in dotTrace Viewer, there are no huge differences between background and server GC.
Learn more about GC types in Microsoft Learn.
To help you distinguish when a GC of a particular type is performed, dotTrace offers you the Garbage Collection: Type sub-filter.
Garbage Collection: Type
The sub-filter shows the distribution of the total GC time between collections of a particular type.
Use this sub-filter to analyze garbage collections: reasons, threads and methods that toggled collections. For example, if you see a significant blocking GC time, it makes sense to switch the Events filter to .NET Memory Allocations and determine the threads with the largest amount of allocated memory. Most likely, these are threads that triggered GCs.

![]() GC type:
GC type:
Blocking - blocking garbage collection. All threads except the one that toggled the GC are suspended. The main subject of your analysis.
Background - performed by a separate GC thread and does not suspend managed threads during the "heaviest" Gen2 collections. Excessive background GCs are also a subject for optimization.
Blocking during background - background GC does not suspend other threads during Gen2 collections. Nevertheless,Gen0 and Gen1 collections (which are an inevitable part of a full GC) still require managed threads to be suspended. Therefore, background GC always implies short blocking GC intervals. The Blocking during background type will filter out these intervals.
![]() Total time spent on GC of the corresponding type summed up for all selected threads.
Total time spent on GC of the corresponding type summed up for all selected threads.
![]() The percentage of time spent on GCs of the corresponding type relative to the total selected time.
The percentage of time spent on GCs of the corresponding type relative to the total selected time.
To apply the Garbage Collection: Type filter
Select the desired GC type in the filter.
After you select a GC type, other filters will show data only for the time intervals where GCs of the selected type were performed.

For better understanding of how dotTrace calculates garbage collection intervals, consider the example.
Example
For example, your application has two threads: User Thread#1 and User Thread#2. At some point, to free up some memory, User Thread#1 toggles blocking Gen0, Gen1 garbage collection (the A1 interval on the diagram below). As memory is still not enough, a GC thread is created. It performs full GC which includes the Gen0, Gen1 blocking collections (C3) and the Gen2 collection (B3 and D3) which does not block other threads.

If you select all three threads on the Threads diagram, the filters will calculate GC time as follows:
Garbage Collection = A1 + B3 + C3 + D3
Garbage Collection: Blocking = A1 + C3
Garbage Collection: Background = B3 + C3 + D3
Garbage Collection: Blocking during Background = C3
Note that in addition to the Garbage Collection event, you can also use the GC Wait subsystem in Subsystems to evaluate the amount of garbage collection on the selected time interval. Do not be confused by different time values shown in Garbage Collection and GC Wait. The thing is while Garbage Collection is calculated only for the thread that actually performed the GC, the GC Wait subsystem time includes all waits of all threads blocked by the GC. Given the example above, GC Wait would be calculated as follows:
GC Wait = A1 + A2 + C1 + C2 + C3
Garbage Collection: Depth
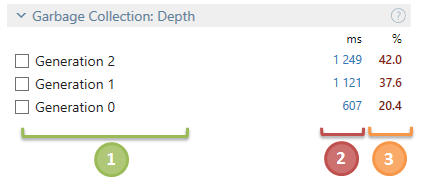
The Garbage Collection: Depth sub-filter shows distribution of GC time between Gen0, Gen1, and Gen2 heaps collections.
Note that the Gen1 collection always implies the collection of the Gen0 heap segment as well. The Gen2 GC (also known as full GC) includes the Gen1 and Gen0 collections. Thus, the time used to perform a Gen0 collection within a Gen1 collection will be aggregated to the Gen1 GC time. The Gen2 GC time will include the times of the Gen0 and Gen1 collections it triggers.

![]() Heap segment name.
Heap segment name.
![]() Total time spent on blocking GCs of the corresponding depth summed up for all selected threads.
Total time spent on blocking GCs of the corresponding depth summed up for all selected threads.
![]() The percentage of time spent on blocking GCs of the corresponding depth relative to the total selected time.
The percentage of time spent on blocking GCs of the corresponding depth relative to the total selected time.
To apply the Garbage Collection: Depth filter
Select the desired heap segment name in the filter.
After you select a heap segment, other filters will show data only for the time intervals where GCs of the selected depth took place.
