Debug Output
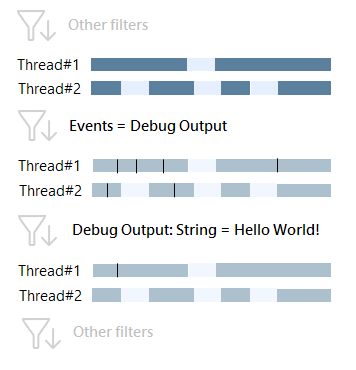
The Debug Output filter shows you point events where the application writes to the debug output, e.g. with the Debug.Write system method (in fact, dotTrace tracks all calls of the OutputDebugString system function). Thus, when Debug Output is selected, Call Tree shows only the methods that write to the output.
Use the Debug Output event for advanced debugging.
Debug Output: String
The sub-filter is used to filter out point events where certain messages were sent to the debug output.
To apply the Debug Output: String filter
Select the desired messages in the filter.
After you select a string, other filters will show only the point events where the selected message was sent to the output. For example, Hotspots in the Call Stack window will show the list of methods that sent such messages.

26 May 2024