Forecast Performance
Typically, the main goal of performance profiling is to determine the methods that slow down your app or a particular feature in your app. But after you find such a method, it makes sense to ensure that optimizing this particular method will increase app performance. dotTrace allows you to exclude any method from the Call Tree and answer the question "What if there were no such function in my app? Would it become faster?"
Note that you can exclude just a single method occurrence from a particular call stack as well as all method occurrences from all call stacks.
To exclude the execution time of a single method occurrence
Select the method in the Call Tree.
Do one of the following:
Right-click the method, then choose Exclude This Call Path from the context menu.
Press Del.
To exclude the execution time of all method occurrences
Select any method occurrence in the Call Tree.
Do one of the following:
Right-click the method, then choose Exclude Method from the context menu.
Press Shift+Del.
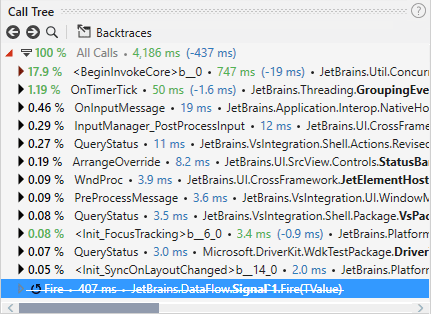
After you exclude a method or all method occurrences, the Call Tree is recalculated (adjusted calls time is shown in green), and the excluded method is shown as strikethrough.

Excluding a method call is equivalent to applying the filter "Select all time intervals where the method was not executed": the list of filters gets a filter with a minus sign:

If you want to return the excluded method calls back to the Call Tree, you can either remove the corresponding filter or right-click the Call Tree and select Restore All Excluded Nodes from the context menu.