Run dotTrace
Depending on your needs, you can work with dotTrace in several ways:
- Standalone application
You run dotTrace as a standalone application installed in your operating system. We strongly recommend that you use JetBrains Toolbox to install and launch dotTrace.
- dotTrace command-line tool
You run dotTrace as a command-line tool.
- dotTrace integrated in Microsoft Visual Studio
You run profiling using the options provided by the dotTrace plugin in Visual Studio.

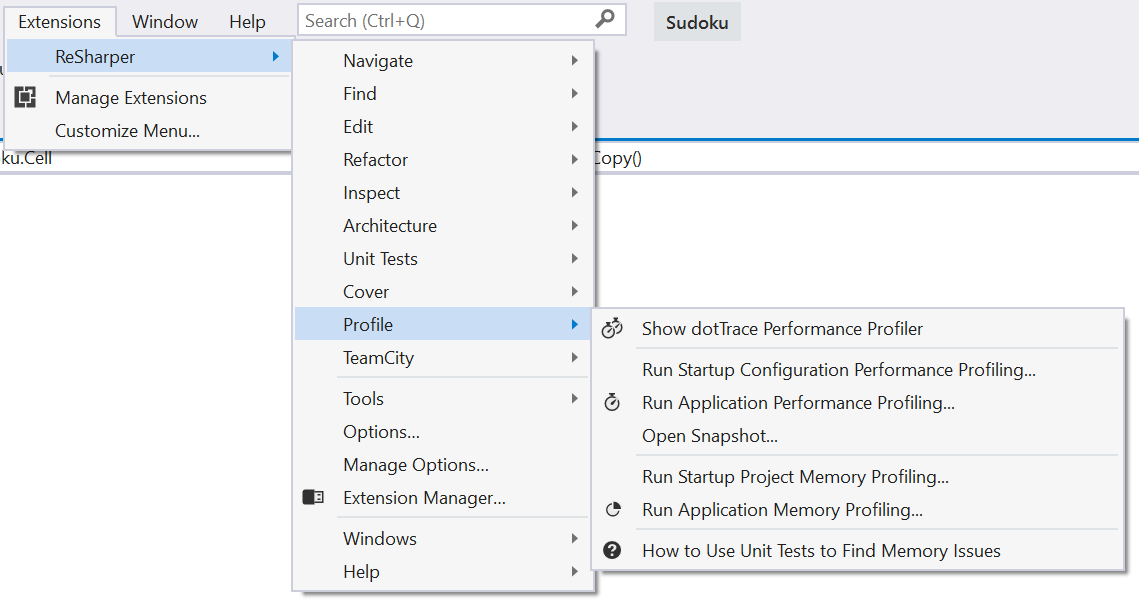
The main component of dotTrace integrated in Visual Studio is the Performance Profiler tool window which can be opened in the menu.
- dotTrace integrated in JetBrains Rider
Out of scope of this documentation.
You run profiling using the options provided by the dotTrace plugin in JetBrains Rider.
The following table summarizes the pros and cons of each way.
Standalone | in Visual Studio | Command-Line Tool | |
|---|---|---|---|
Summary | Recommended if you do not have application's source code or you do not want to start an IDE to perform profiling | Recommended if you want to profile an existing project running under Visual Studio | Recommended if you want to perform profiling on a remote server or automate the profiling process |
OS | Windows, Linux, macOS | Windows | Windows, Linux, macOS |
How to Run Profiling | Using the dotTrace Home window | Using the menu in Visual Studio | Using the dotTrace.exe/dotTrace.sh command-line tool |
Local Profiling |
|
| |
Controlling Profiling Session |
|
|
|
Continuous Integration Support |
|