Python console
Python console enables executing Python commands and scripts line by line, similar to your experience with Python Shell.
Actions available in the Python console
In an interactive console, you can:
Type commands in the lower pane of the console, and press Enter to execute them. Results are displayed in the upper pane.
Use basic code completion Ctrl+Space and tab completion.
Use Up and Down arrow keys to scroll through the history of commands, and execute the required ones.
Load source code from the editor into console.
Use context menu of the upper pane to copy all output to the clipboard, compare with the current contents of the clipboard, or remove all output from the console.
Use the toolbar buttons to control your session in the console.
Configure color scheme of the console to meet your preferences. Refer to the section Configure color schemes for consoles for details.
Working with Python console
The console appears as a tool window every time you choose the corresponding command on the Tools menu. You can assign a shortcut to open Python console: press Ctrl+Alt+S, navigate to Keymap, specify a shortcut for Main menu | Tools | Python or Debug Console.
The main reason for using the Python console within PyCharm is to benefit from the main IDE features, such as code completion, code analysis, and quick fixes.

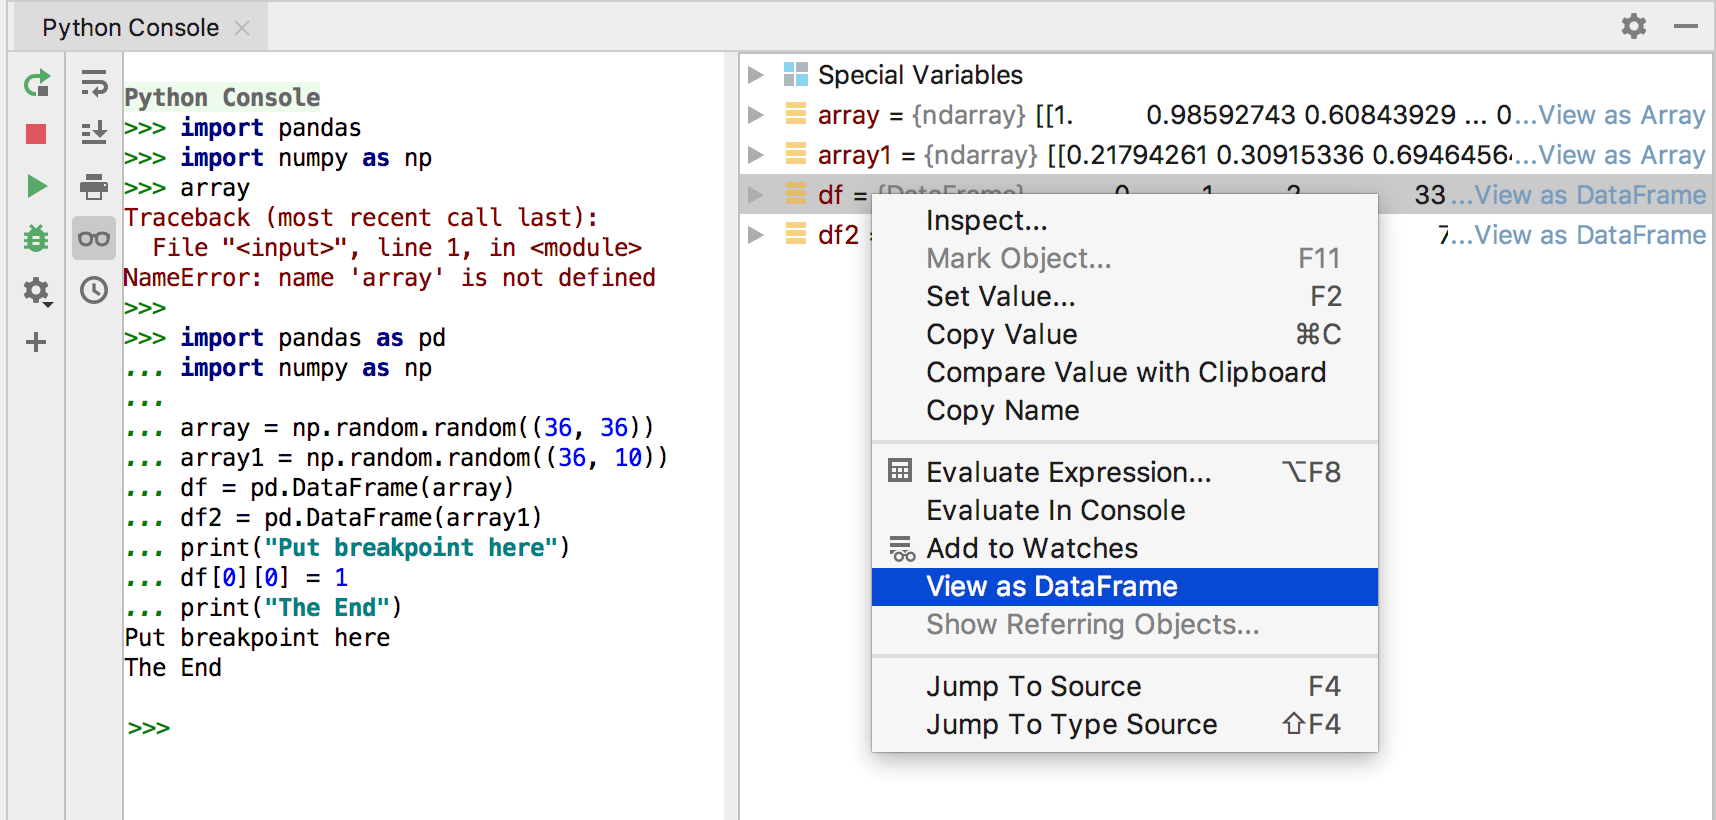
You can use up and down arrow keys to browse through the history of executed commands, and repeat the desired ones. To preview the variable values calculated in the course of the execution, click and check the Special Variables list.

The console is available for all types of Python interpreters and virtual environments, both local and remote.
Preview a variable as an array
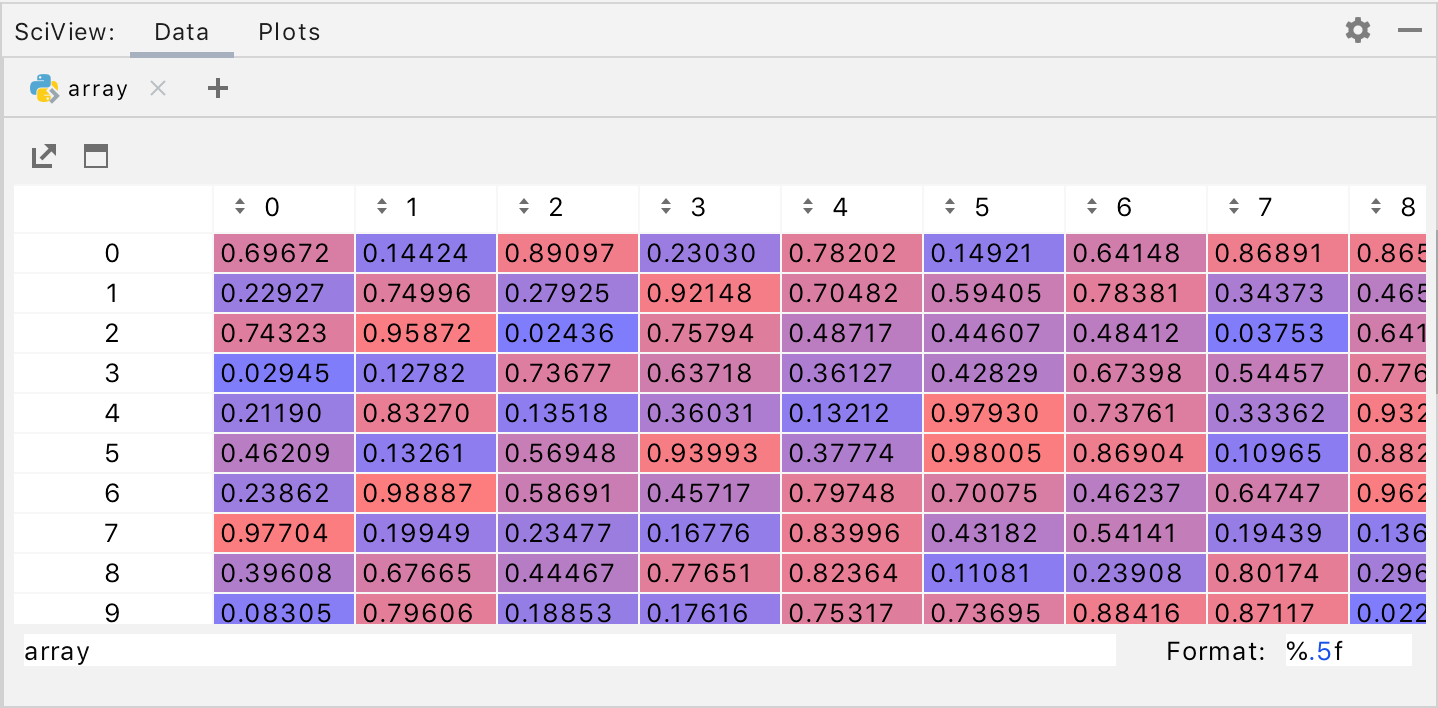
When your variables are numpy arrays or dataframes, you can preview them as an array in a separate window. To try it, do one of the following:
Click the link View as Array/ View as DataFrame:

From the context menu of a variable, choose View as Array/ View as DataFrame:

The variable will be opened in the Data tab of the SciView window.

Run source code from the editor in console
Open file in the editor, and select a fragment of code to be executed.
From the context menu of the selection, choose Execute selection in console, or press Alt+Shift+E:

note
With no selection, the command changes to Execute line in console. Choose this command from the context menu, or press Alt+Shift+E. The line at caret loads into the Python console, and runs.
Watch the code selection execution:

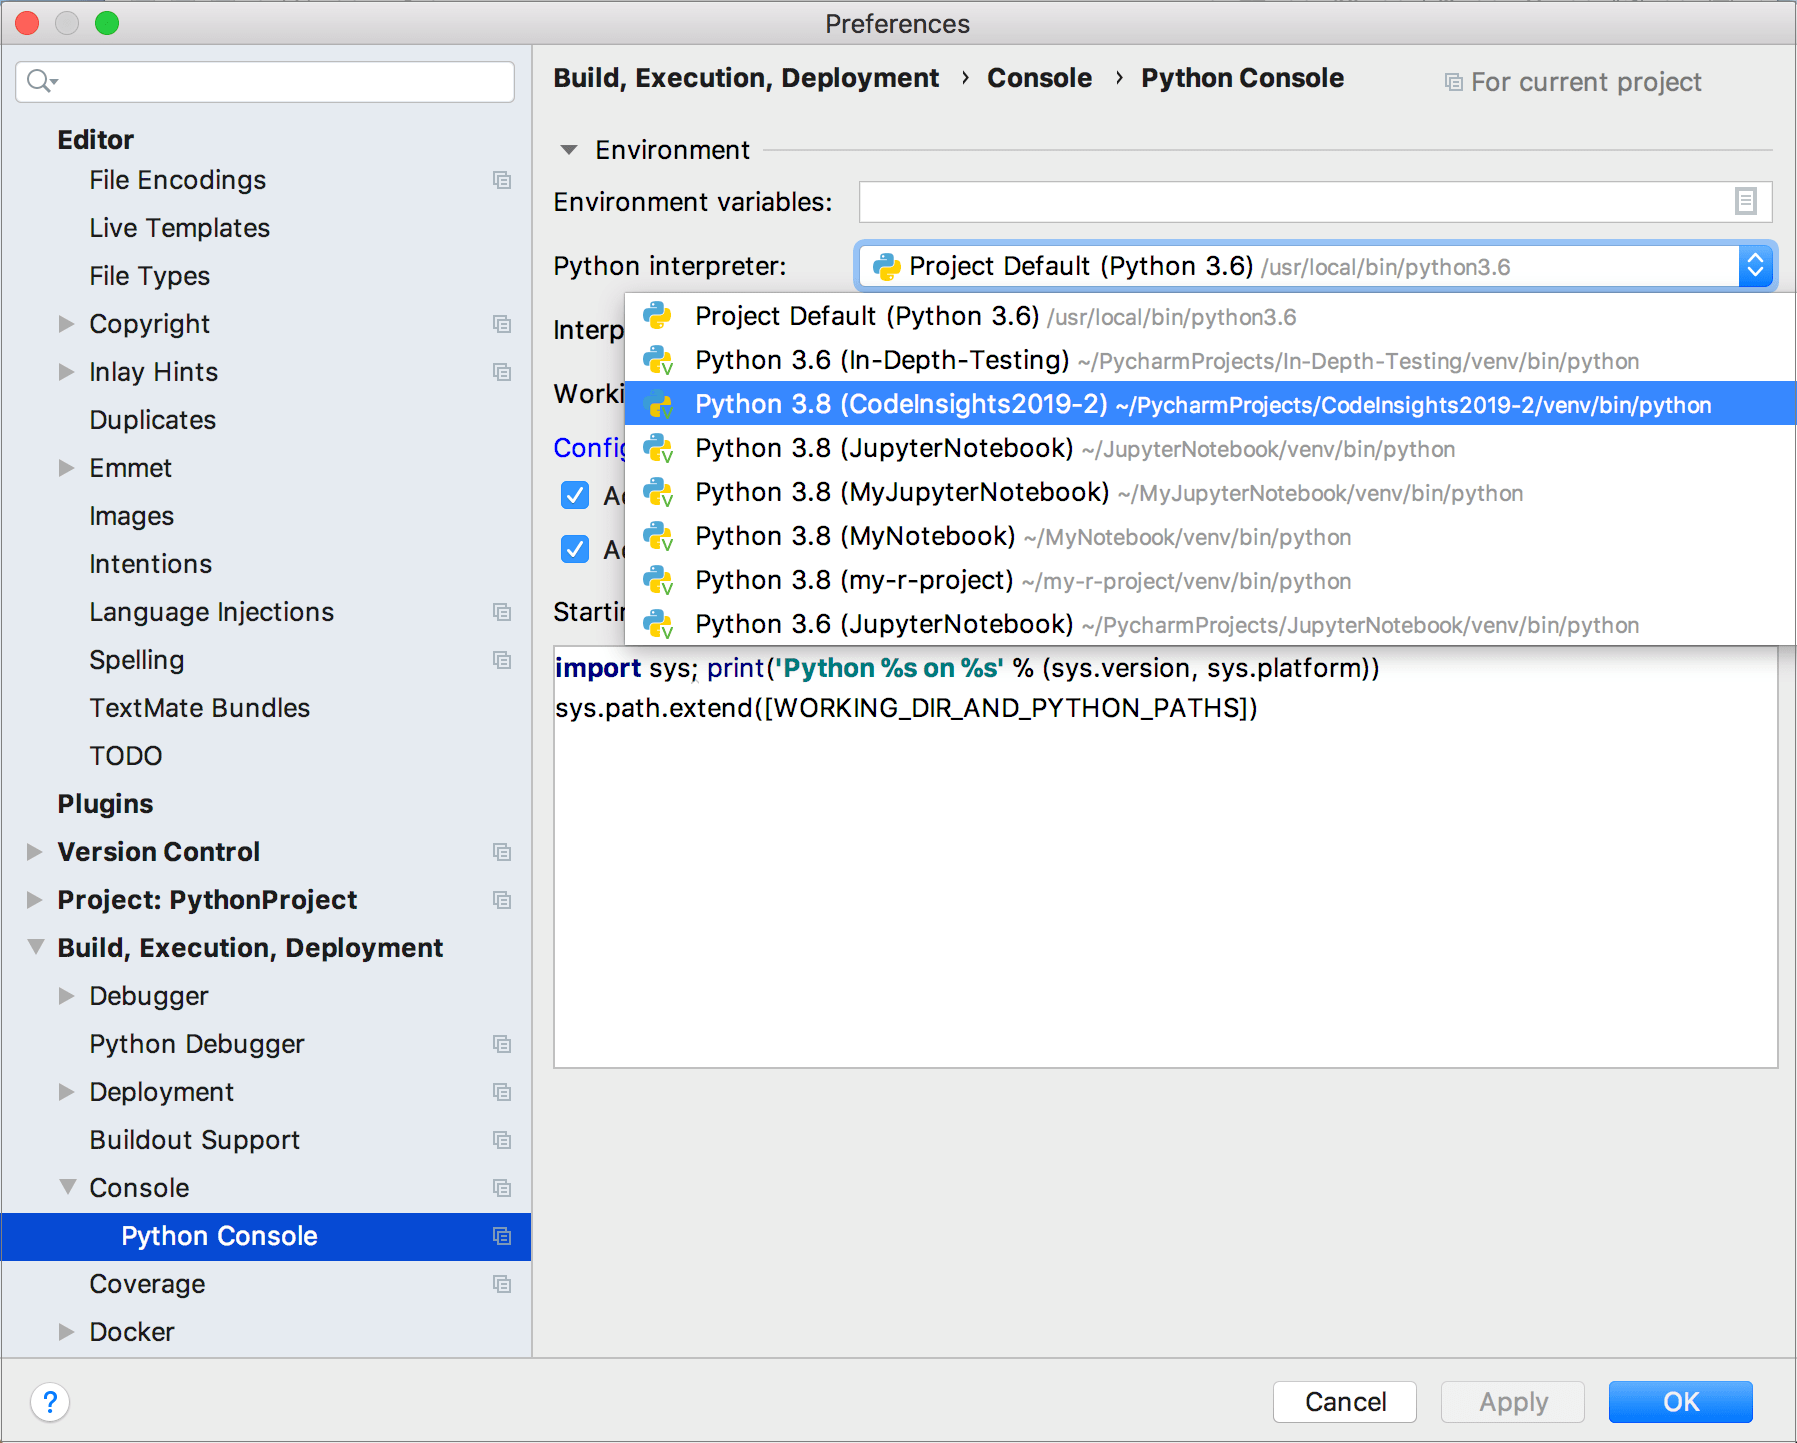
By default, the Python console executes Python commands using the Python interpreter defined for the project. However, you can assign an alternative Python interpreter.
Configure Python console settings
In the Settings/Preferences dialog Ctrl+Alt+S, select Build, Execution, Deployment | Console | Python Console.
Select any available interpreter from the Python interpreter list. Note that you cannot introduce a new interpreter here. If you want to come up with the new interpreter, you need to create it first.

In needed, click the Configure Interpreters link to inspect the list of the installed packages and add new ones.
Mind the code in the Starting script area. It contains the script that will be executed after you open the Python console. Use it to pre-code some required Python commands.
When working on several Python scripts, you might want to execute each in a separate Python console.
Run several Python consoles
Click
to add a new Python console.
By default, each console has the name Python Console with an index. To make a console reflect the script you're running, right-click the console tab, select Rename Console, and enter any meaningful name.

Toolbar
| Item | Tooltip and shortcut | Description |
|---|---|---|
| Rerun console Ctrl+F5 | Click this button to terminate the current process and launch the new one. | |
| Stop Ctrl+F2 | Click this button to stop the current process. Clicking the button once invokes soft kill allowing the application to catch the | |
| Execute Current Statement Enter. | Click this button to execute the command at caret, entered in the input pane of the console. | |
| Attach Debugger | Attaches the debugger process to the console. | |
| Settings | You can specify the following settings of the Python console:
| |
| New Console | Click this button to start a new console session. | |
| Use Soft Wraps | Click this button to toggle the soft wrap mode of the output. | |
| Scroll to the end | Click this button to navigate to the bottom of the stack trace and have the cursor jump to the corresponding location in the source code. | |
| Click this button to send the console text to the default printer. | ||
| Show variables | Click this button to show in a separate pane the variables declared in the console. Right-click a variable in this pane reveals a context menu. | |
| Browse History Ctrl+Alt+E | Open a dialog that shows all the statements that you have run for the corresponding data source. See also, Using the History dialog. |
Context menu commands
| Command | Shortcut | Description |
|---|---|---|
| Show selection in the console and contents of the Clipboard in the Differences viewer. | ||
| Pause Output | Pause the Python script execution output | |
| Choose this command to create a Git Gist. | ||
| Choose this item from the context menu to delete all messages from the upper part of the console. |