Jupyter notebook support
Professional feature: download PyCharm Professional to try.
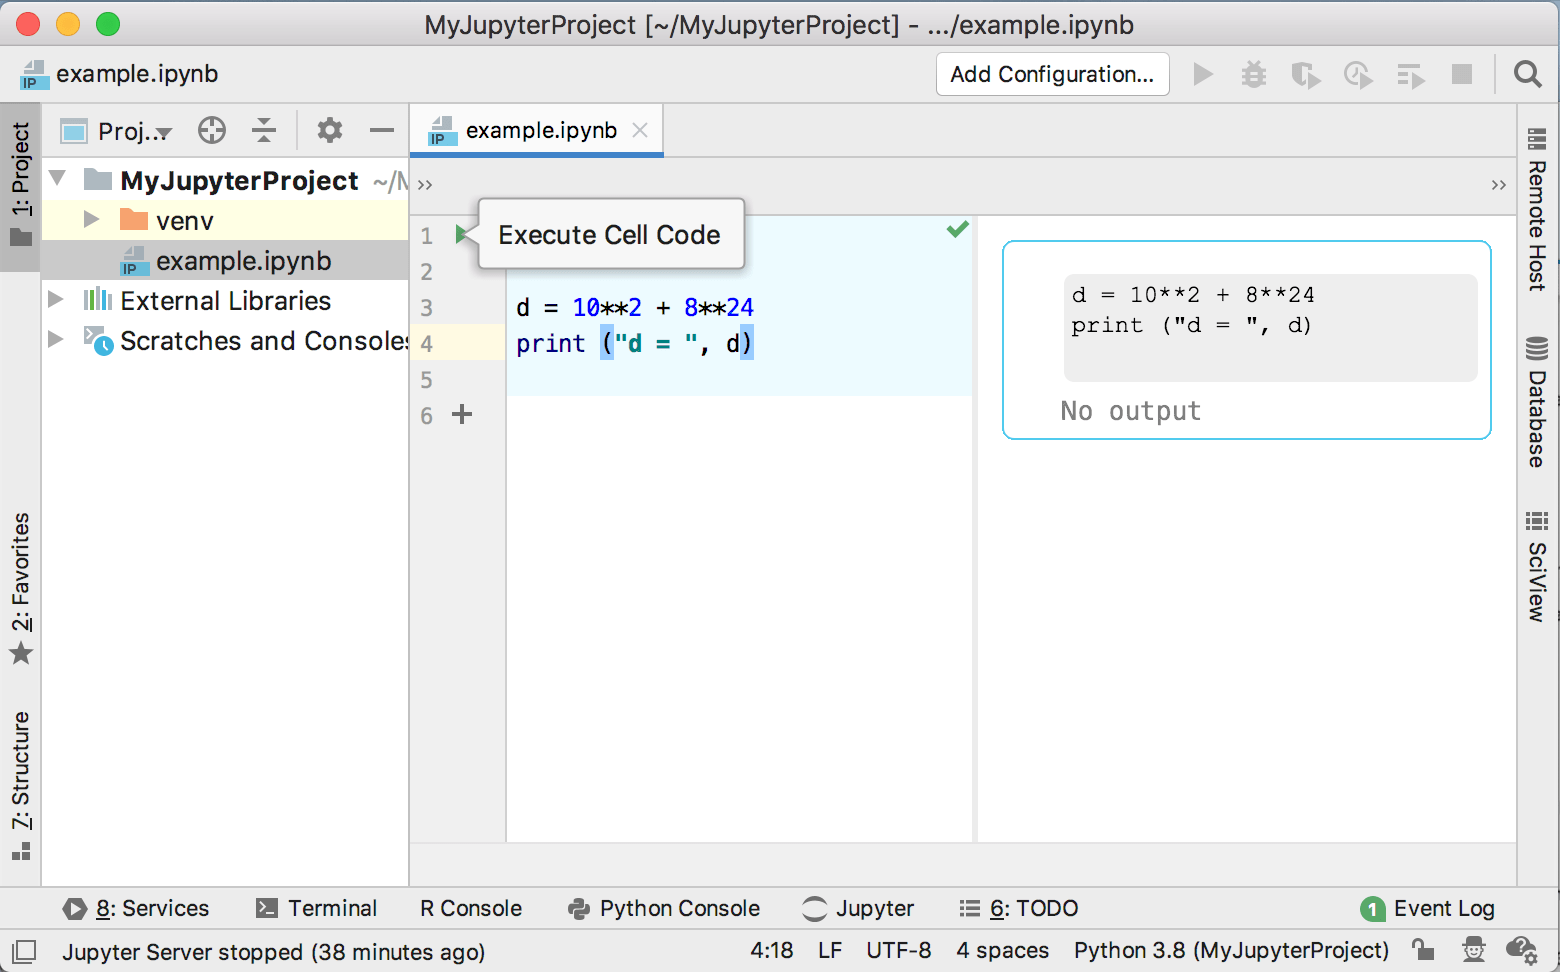
With Jupyter Notebook integration available in PyCharm , you can easily edit, execute, and debug notebook source code and examine execution outputs including stream data, images, and other media.

note
You can try JetBrains DataSpell, a new IDE that is tailored to the data science workflow. It provides a brand-new experience for working with Jupyter notebooks. The IDE is available as part of the Early Access program to collect early feedback and gain insight into the needs and behavior of data scientists. See the JetBrains DataSpell Getting Started Guide for more details.
Notebook support in PyCharm includes:
Editing and preview:
Ability to present a notebook as source code with textual cell definitions and manipulate cells as regular code.
Live preview of the cell execution output and Markdown content.
Auto-saving changes that you make in your files. Saving is triggered by various events, for example, closing a file or a project, or quitting the IDE.
Coding assistance:
Error and syntax highlighting.
Ability to create line comments Ctrl+/.
Ability to run cells and preview execution results.
Dedicated Jupyter Notebook Debugger.
Shortcuts for basic operations with Jupyter notebooks.
Ability to recognize .ipynb files and mark them with the
icon.
Quick start with the Jupyter notebook in PyCharm
To start working with Jupyter notebooks in PyCharm:
Create a new Python project, specify a virtual environment, and install the jupyter package.
Open or create an .ipynb file.
Add and edit source cells.
Execute any of the code cells to launch the Jupyter server.
Analyze execution results in the Preview pane.

Get familiar with the user interface
Mind the following user interface features when working with Jupyter notebooks in PyCharm.
Notebook editor
In PyCharm, you can work with Jupyter notebook files using three viewing modes:
In this mode, you can add notebook cells and edit them.

Editing and preview modes reflect the currently selected PyCharm user interface appearance.
Notebook toolbar
The Jupyter notebook toolbar provides quick access to all basic operations with notebooks:
![]()
Opens the Jupyter Quick List for easy access to the basic notebook operations:
| |
|---|---|
Executes all cells in the notebook. | |
Click this icon if you want to interrupt any cell execution. | |
Click this icon to restart the currently running kernel | |
| Upload to Datalore/Update uploaded notebook. Enables sharing the selected Jupyter notebook using Datalore, an intelligent web application for data analysis. Click this button to start sharing the current notebook file. Once you modify the notebook file, this button enables updating the shared notebook in Datalore. |
| The Jupyter Server widget that shows the currently used Jupyter server. Click the widget and select Configure Jupyter Server to setup another local or remote Jupyter server. |
| List of the available Jupyter kernels. |
| Select this checkbox to allow executing JavaScript in your Jupyter notebook. |
You can preview the notebook in a browser. | |
Enables auto scrolling from the source cell in the Editor to the corresponding output in the Preview pane. | |
Enables auto scrolling from the cell output in the Preview pane to the corresponding source cell in the Editor. | |
| Click this icon to show source code fragments in the Preview pane. |
| Click this icon to switch into the editor only viewing mode. |
| Click this icon to show both Editor and the Preview pane. |
| Click this icon to switch into the preview only mode. |
Tool windows
The Server Log tab of the Jupyter tool window appears when you have any of the Jupyter server launched. The Server log tab of this window shows the current state of the Jupyter server and the link to the notebook in a browser.

It also provides controls to stop the running server (![]() ) and launch the stopped server (
) and launch the stopped server ().
The Jupyter Variables tool window the detailed report about variable values of the executed cell.

You can use the icon to manage the variables loading policy.