Scientific mode
Available only in PyCharm Professional: download to try or compare editions
Scientific mode in PyCharm provides support for interactive scientific computing and data visualization.
To enable the Scientific mode use one of the following ways
Go to View | Scientific mode.
In your code, add an import statement for
numpy. PyCharm shows the banner that suggests that you enable the Scientific mode:
Click the Use scientific mode link on the banner.
With this mode enabled, the following changes are introduced to the UI:
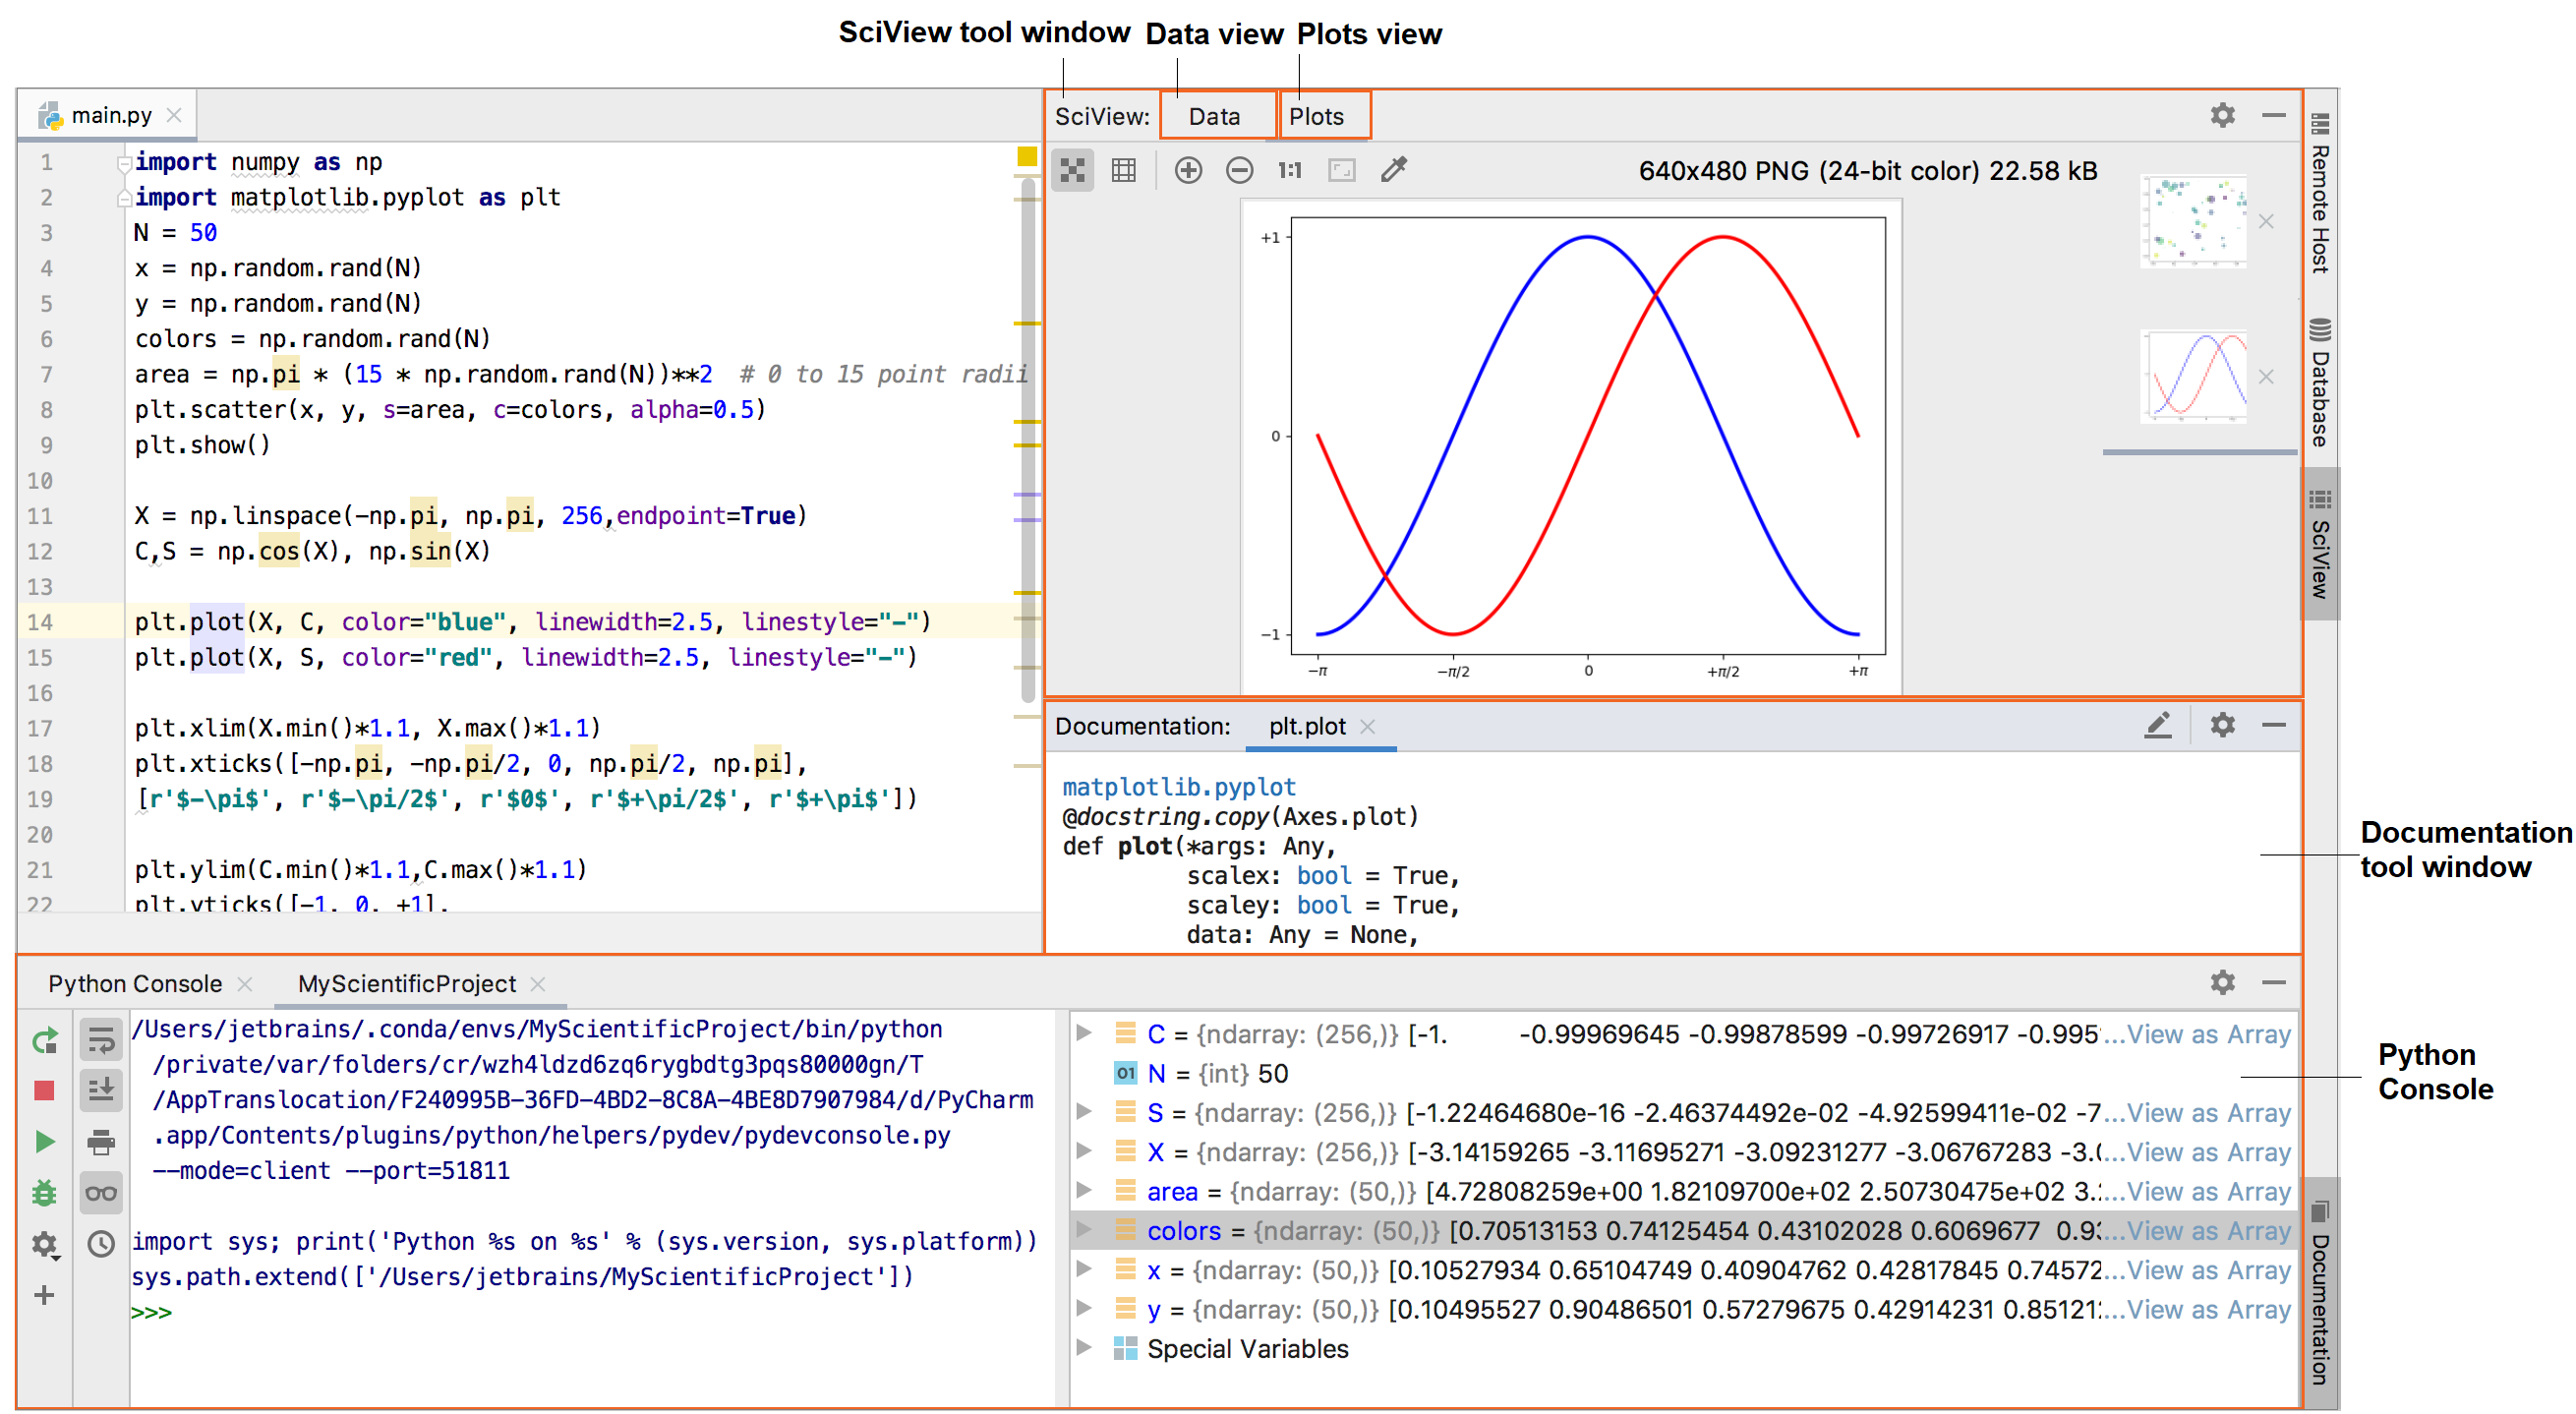
The SciView tool window appears. It has two tabs:
Data tab for viewing data from pandas DataFrames and numpy arrays.
Plots tab for viewing Matplotlib charts.
Python console is shown.
The Documentation tool window appears (a pinned version of the Quick Documentation popup), showing the inline documentation for the symbol at caret.
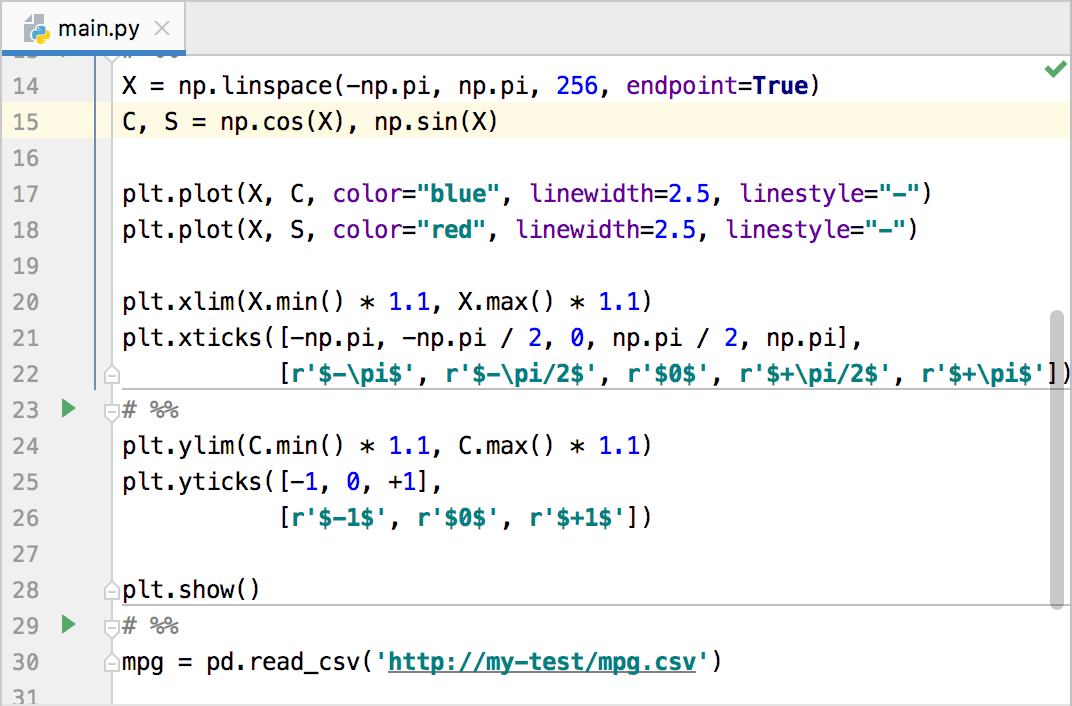
In the Scientific mode you can format your code as a set of executable cells to run each separately. To split your code into cells just add # %% lines where appropriate.
You can get all the Scientific mode settings predefined by choosing the corresponding project type in the New Project wizard.
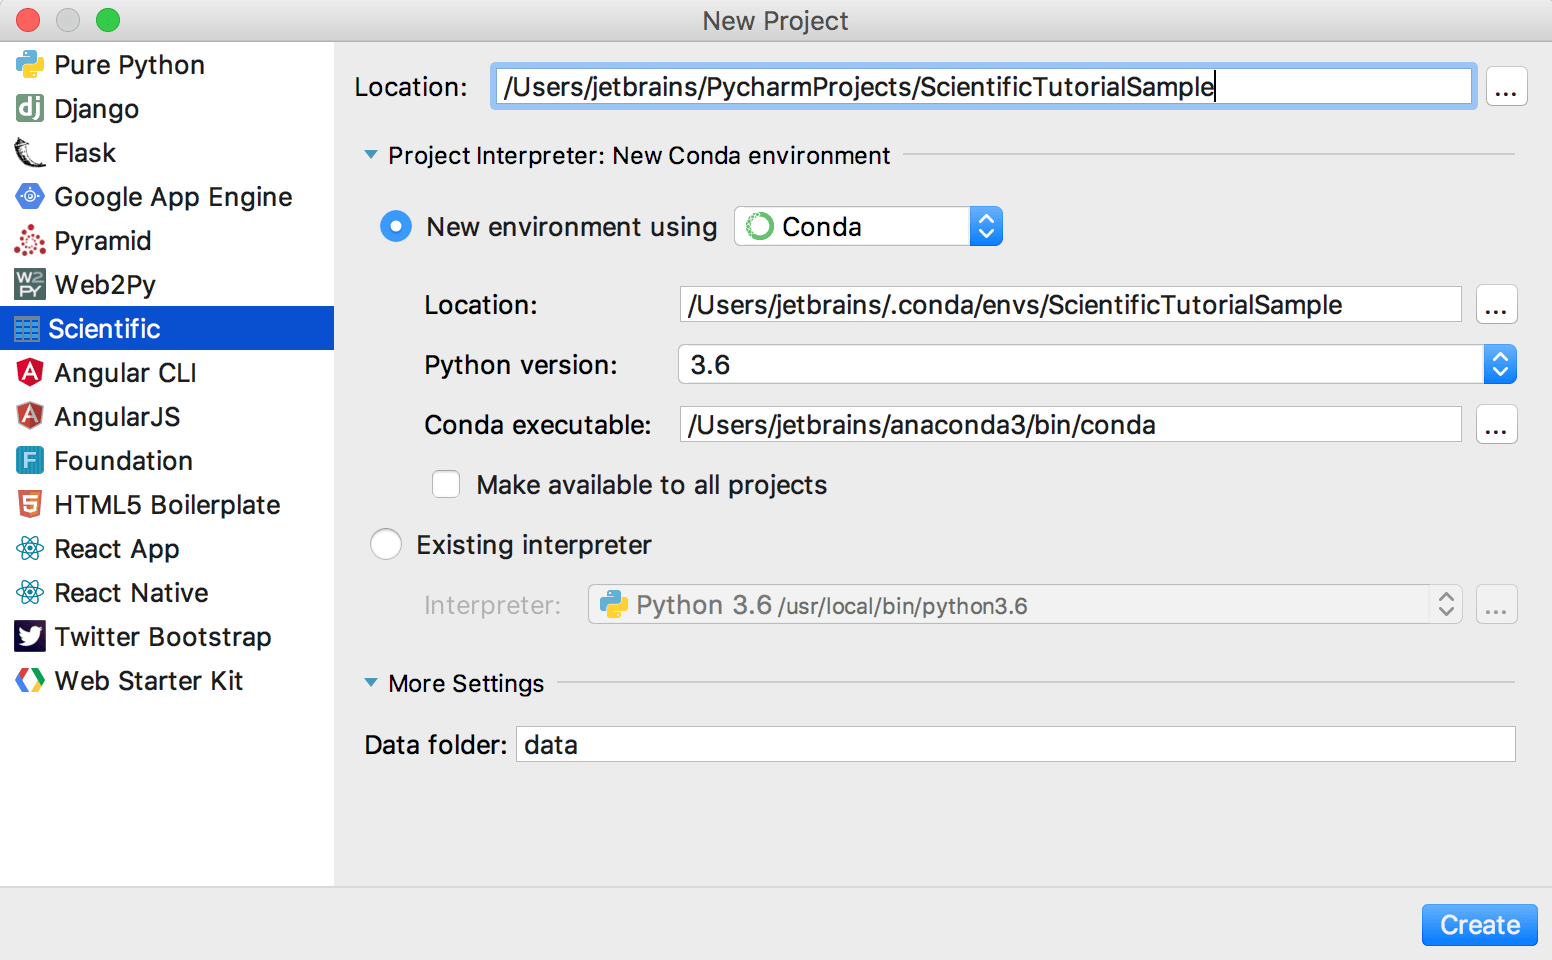
When choosing the Scientific project type, you need to ensure that you have Conda interpreter installed. Once this is done, all you need is to specify the project name. You can also alter the name of the data folder if needed.
Note that to work with Matplotlib, Numpy, or or Pandas, you need to install these packages on your Python interpreter.
When you preview variable in the Python Console, you can click DataFrame or Array links to view these types in the Data tab of the SciView tool window.
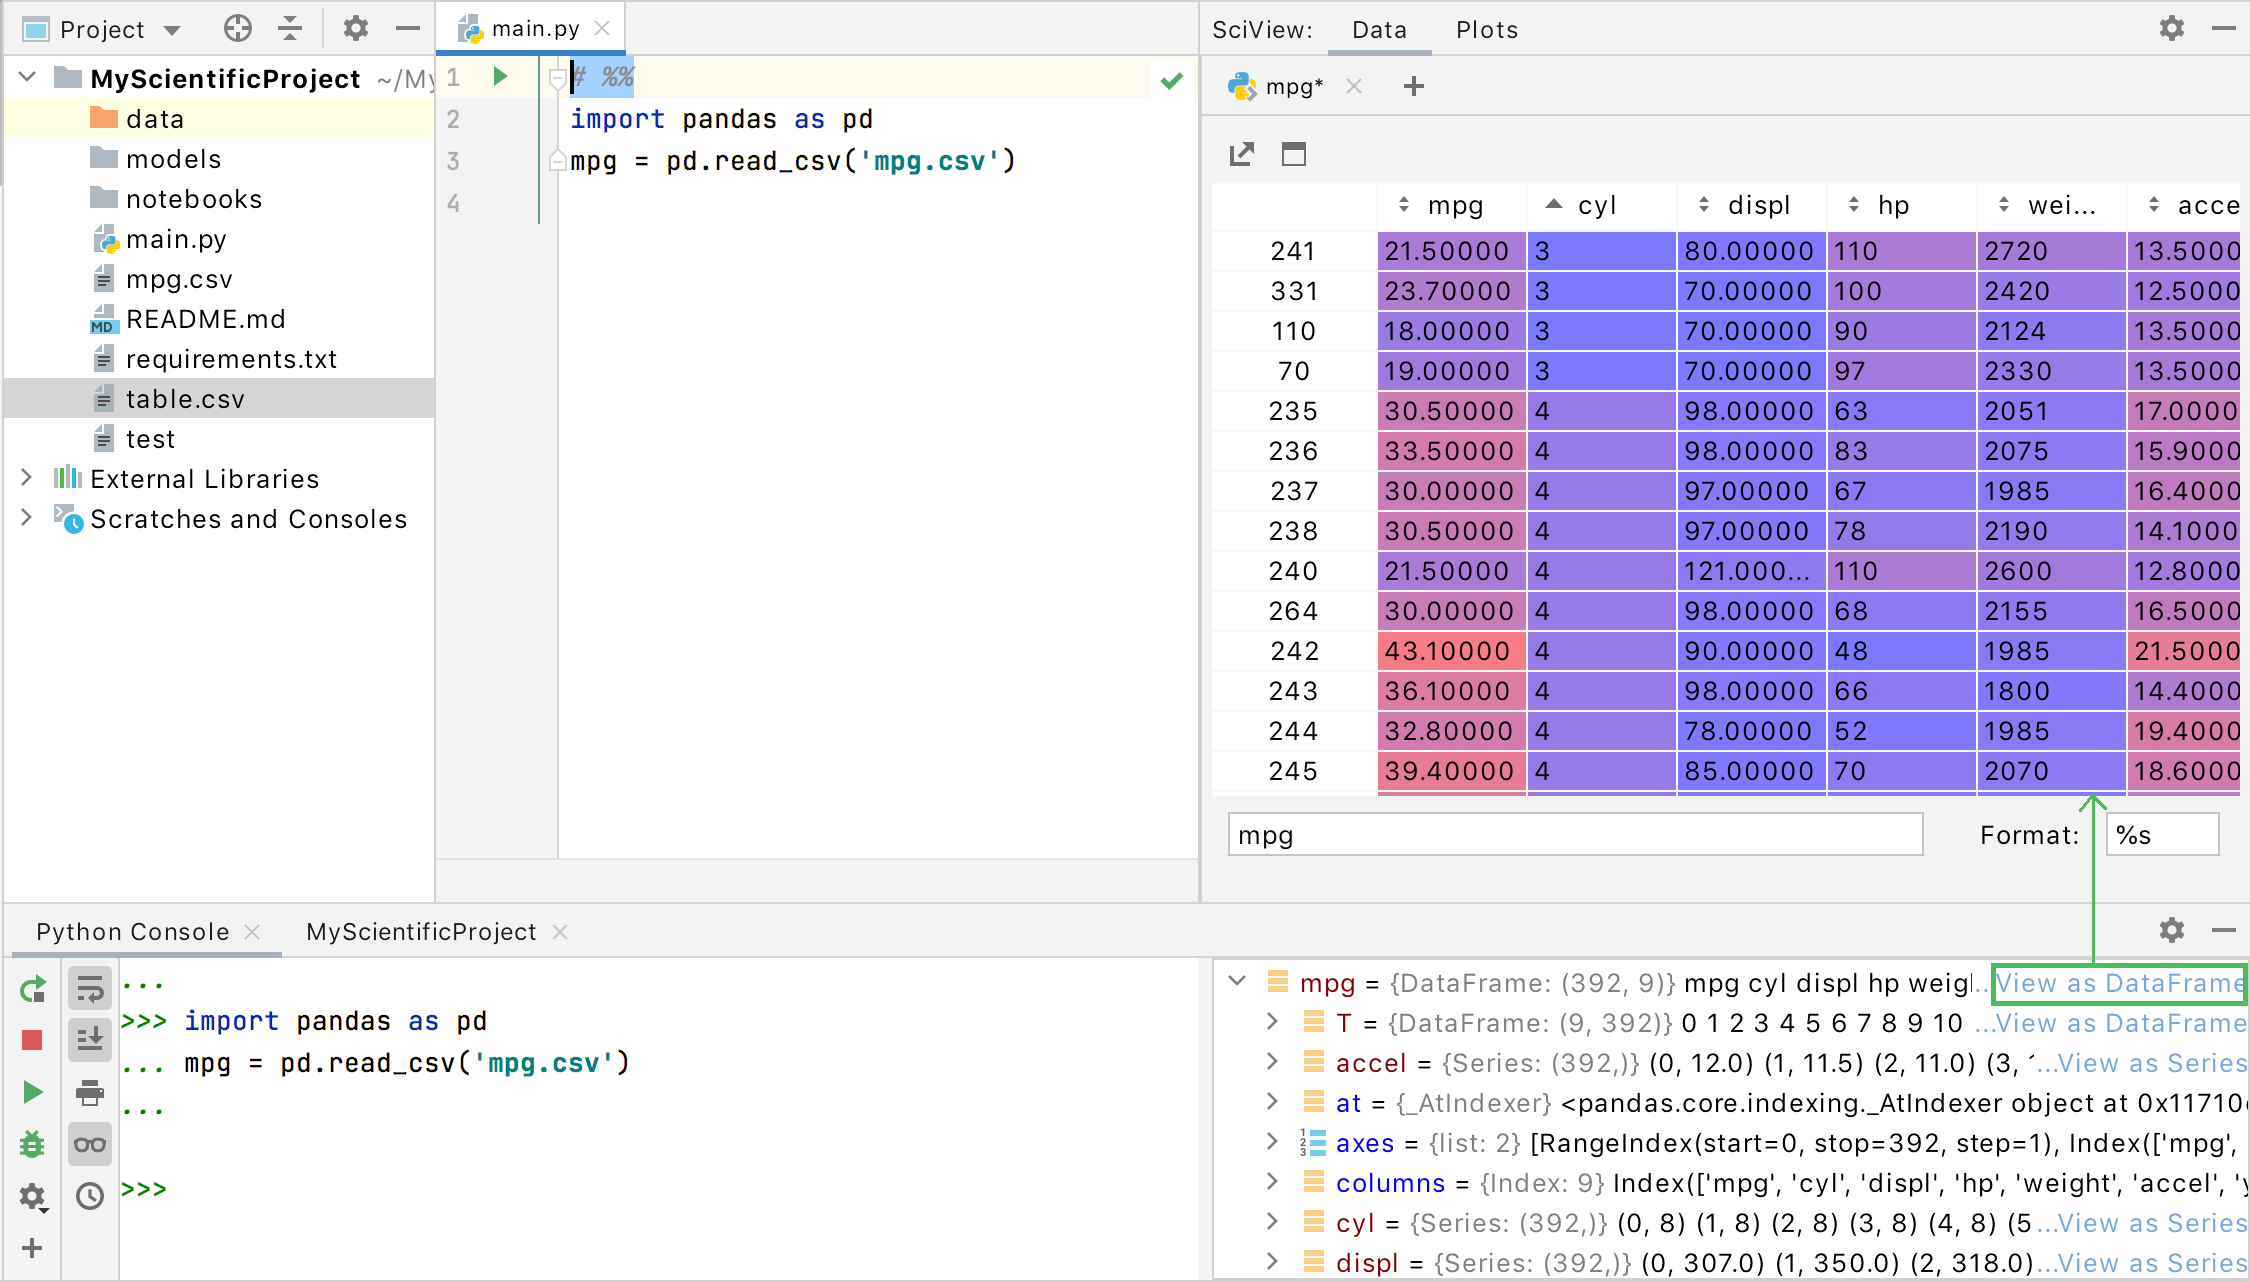
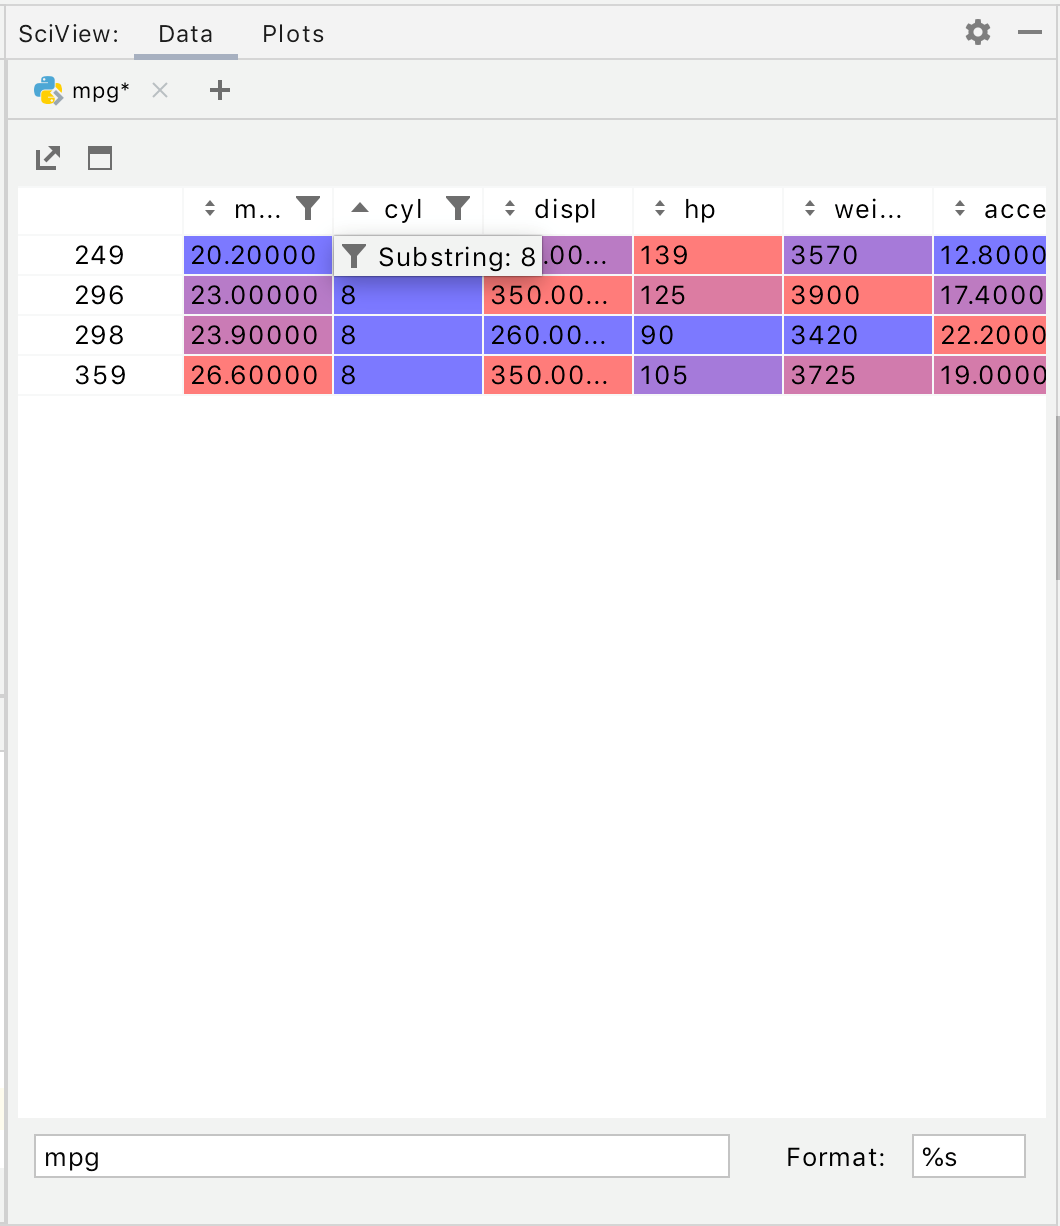
You can sort data in a table column by clicking a soring icon (![]() ) on its header. You can also filter out data in the table by selecting a column name and typing a substring or an expression.
) on its header. You can also filter out data in the table by selecting a column name and typing a substring or an expression.
Set a value (for example, 8) or use a wildcard (for example, 8*):
Type an expression using x as a column value variable (for example, x > 20):
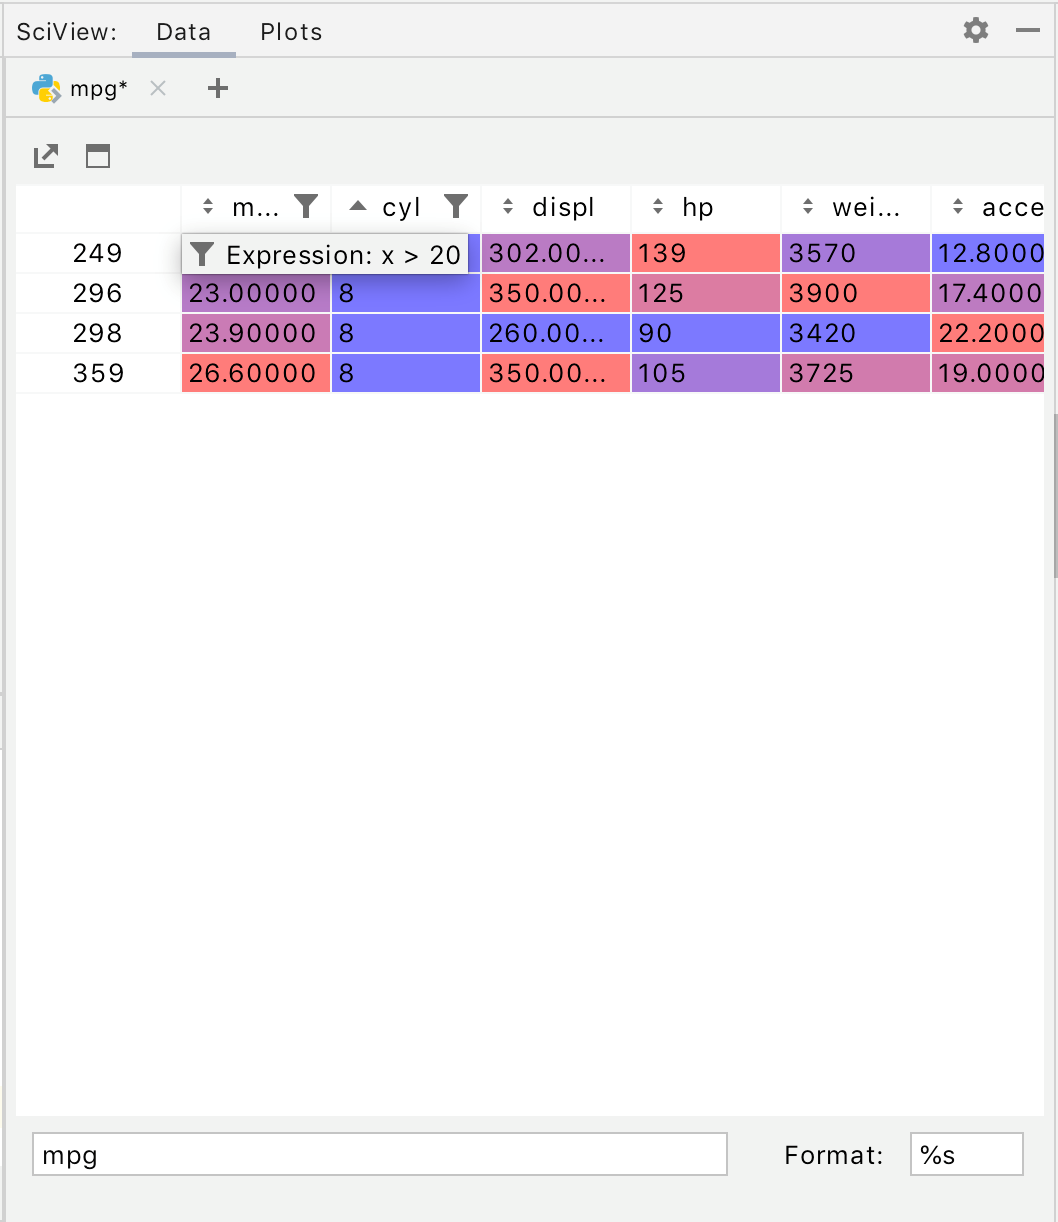
A column with an applied filter is marked with the filter icon (). Hover over it to see the filter value.
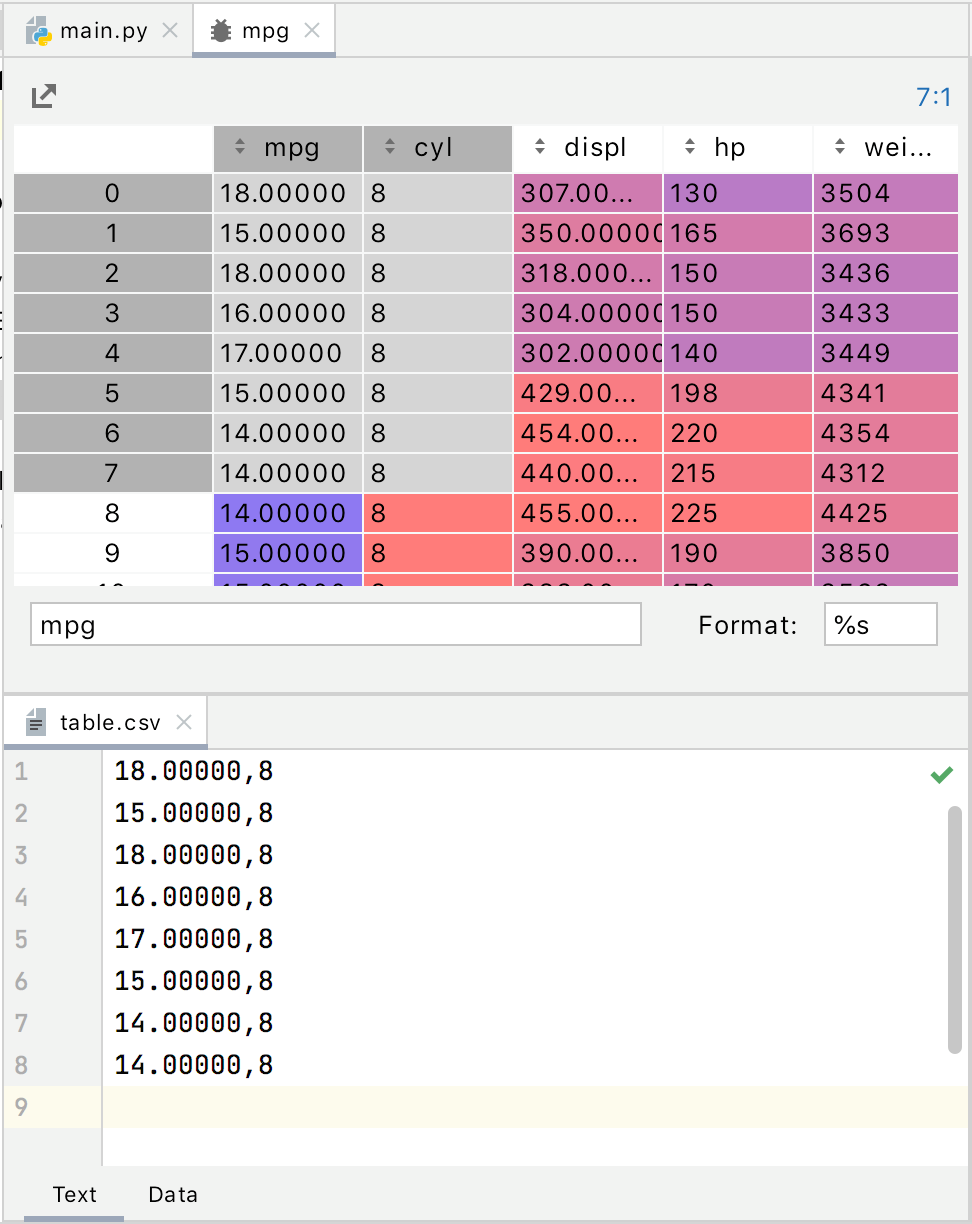
Any table can be saved () or opened in a separate tab of the editor (
). You can also select any cells in the table and copy them to the clipboard (). The copied cells can be pasted into any file, for example, .csv.
In the Scientific mode, a graph opens in its own tab in the SciView window, allowing you to resize it, and to zoom it in and out.
note
Interactive plots in the SciView window are not supported by PyCharm at the moment. If you want to use the mouse pointer to see the values at specific graph points, you can render plots in the native matplotlib GUI. To do that, disable the Show plots in tool window checkbox in Settings | Tools | Python Scientific.
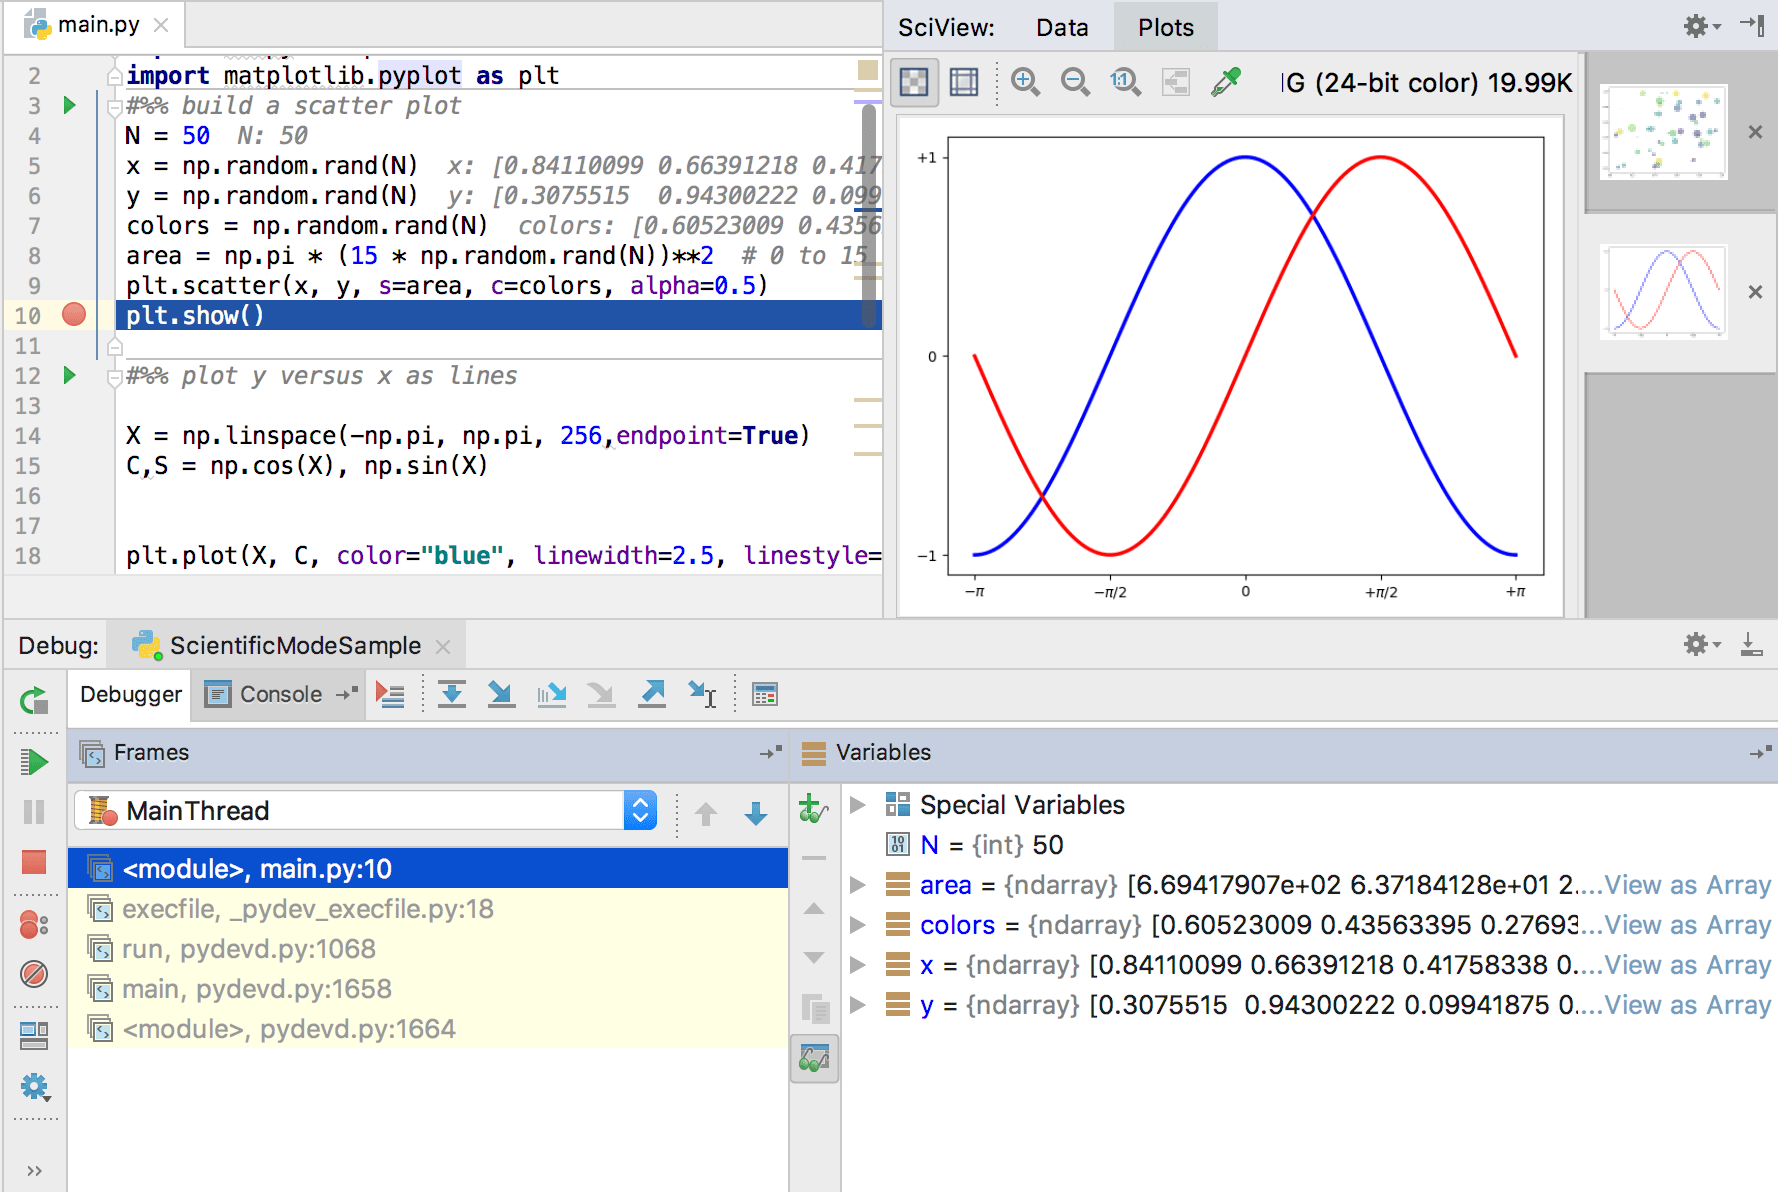
When stopping on a breakpoint, a tab appears in the SciView with the graph being debugged. See the Debug section of the Scientific Mode tutorial.
Matplotlib is available also in console. See the Running in console section of the Scientific Mode tutorial. When starting a Python console (Tools | Python Console...), one can import Matplotlib, and build graphs as required:
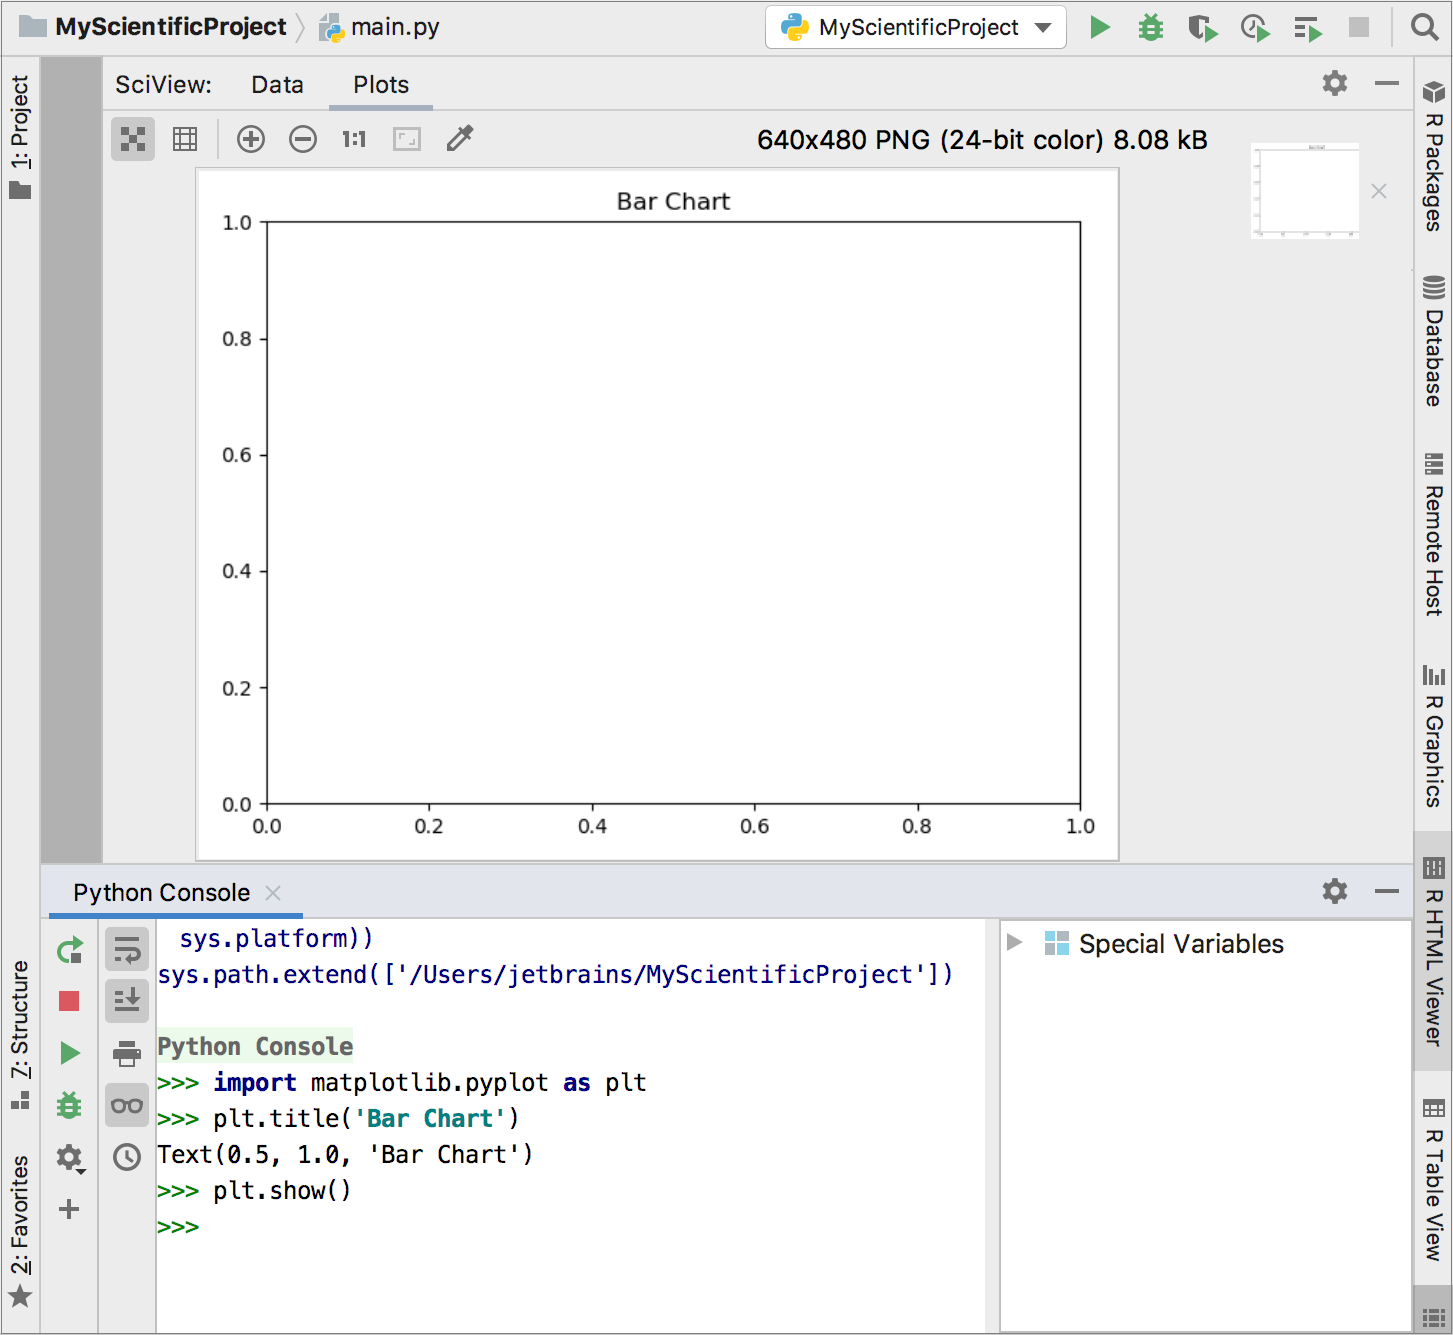
The Python console is accessible for further inputs.