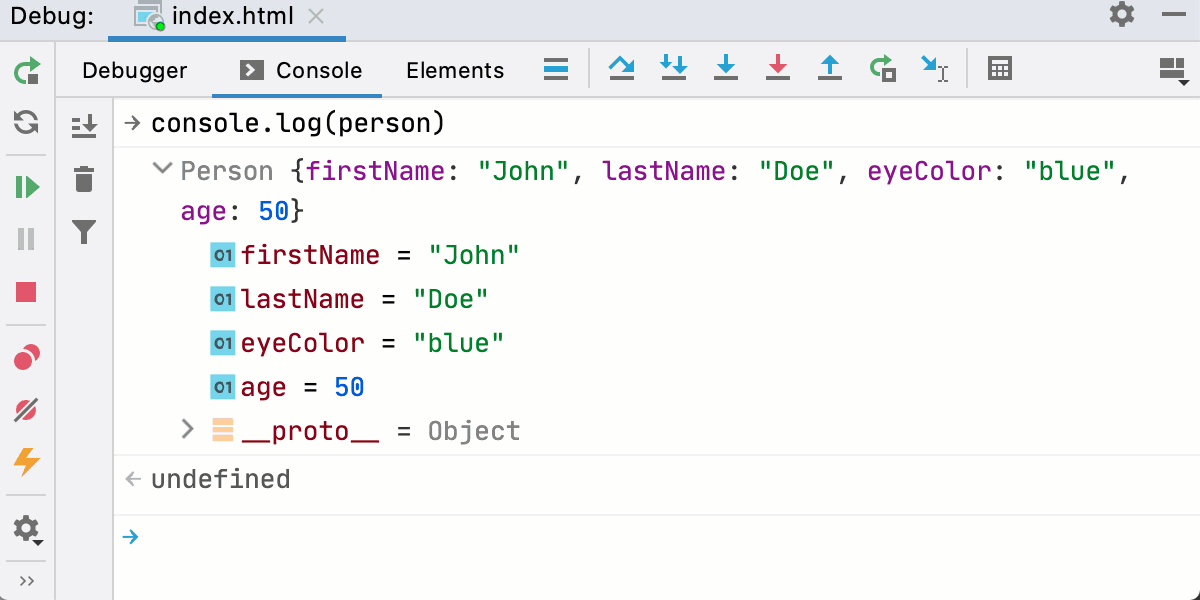
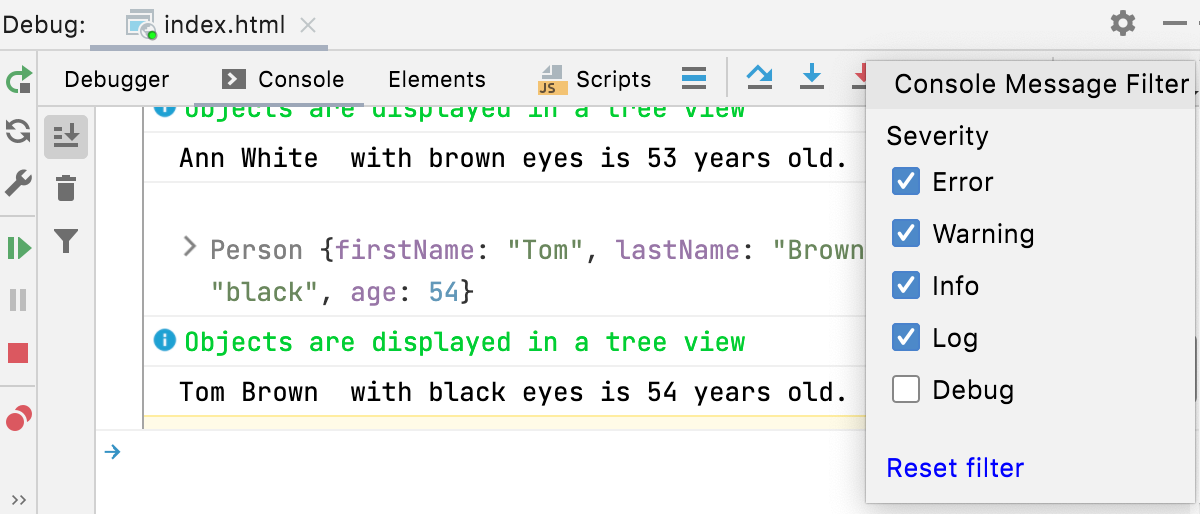
Interactive debugger console
note
The interactive Console pane is shown only when you are debugging an application or debugging a test. It is not available when you are running an application or previewing web pages.
Debugging of JavaScript code is only supported in Google Chrome and in other Chromium-based browsers.

Gif
Thanks for your feedback!
Was this page helpful?


