Part 3. Debugging JavaScript
The possibility to debug JavaScript is vital for web developers. With IntelliJ IDEA-based products, such debugging becomes quite easy. To illustrate the JavaScript debugging capabilities with PyCharm, we’ll create a very basic script that just shows some numbers in a browser page, and then debug it on a server.
Before you start
Make sure the JavaScript and TypeScript bundled plugin is enabled in the settings. Press Ctrl+Alt+S to open settings and then select . Click the Installed tab. In the search field, type JavaScript and TypeScript. For more information about plugins, refer to Managing plugins.
Make sure the JavaScript Debugger bundled plugin is enabled in the settings. Press Ctrl+Alt+S to open settings and then select . Click the Installed tab. In the search field, type JavaScript Debugger. For more information about plugins, refer to Managing plugins.
Configure the built-in debugger as described in Configuring JavaScript debugger.
To have the changes you make to your HTML, CSS, or JavaScript code immediately shown in the browser without reloading the page, activate the Live Edit functionality. For more information about the live editing functionality, refer to Live Edit in HTML, CSS, and JavaScript.
Debugging JavaScript locally
Let's start with the most basic scenario: debugging JavaScript when it's located in one folder with the HTML file.
Create a Pure Python project as described in Create a Python project.
Create two file in the project root (for information, refer to Create new files):
index.html:
<!DOCTYPE html> <html> <head> <title>Character count</title> </head> <body> <form id="form"> <input type="text" id="inputText" placeholder="Enter text"> <button type="submit">Send</button> </form> <p id="output">Character count: </p> <script src="script.js"></script> </body> </html>script.js
document.getElementById("form").addEventListener("submit", function(event){ event.preventDefault(); let inputText = document.getElementById("inputText").value; let characterCount = inputText.length; document.getElementById("output").innerHTML = "Character count: " + characterCount; });
Set a breakpoint on the line 6 of script.js by clicking the line number.

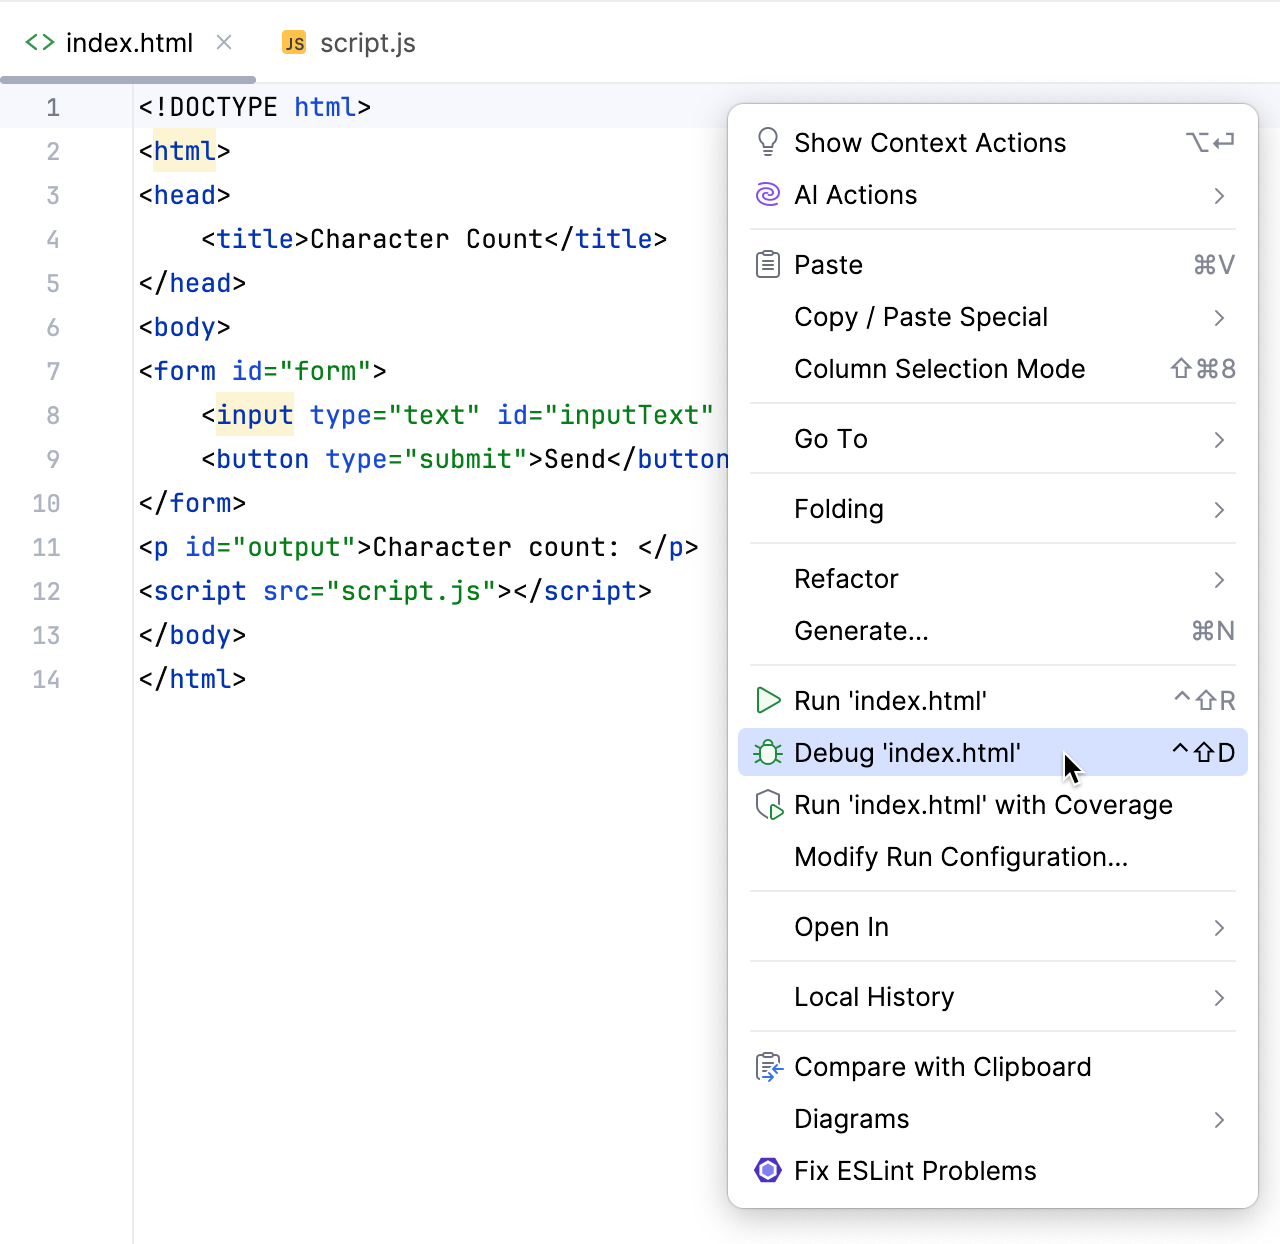
Switch to index.html and start the debugger by selecting Debug index.html from the context menu. Alternatively, press Shift+F9.
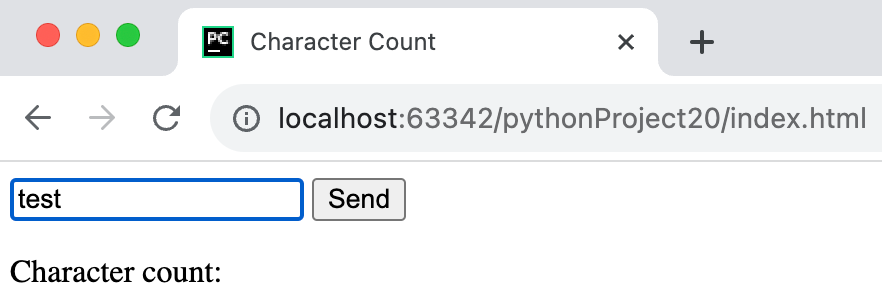
PyCharm opens the browser with index.html. Type any text in the field and press Enter or click Send.
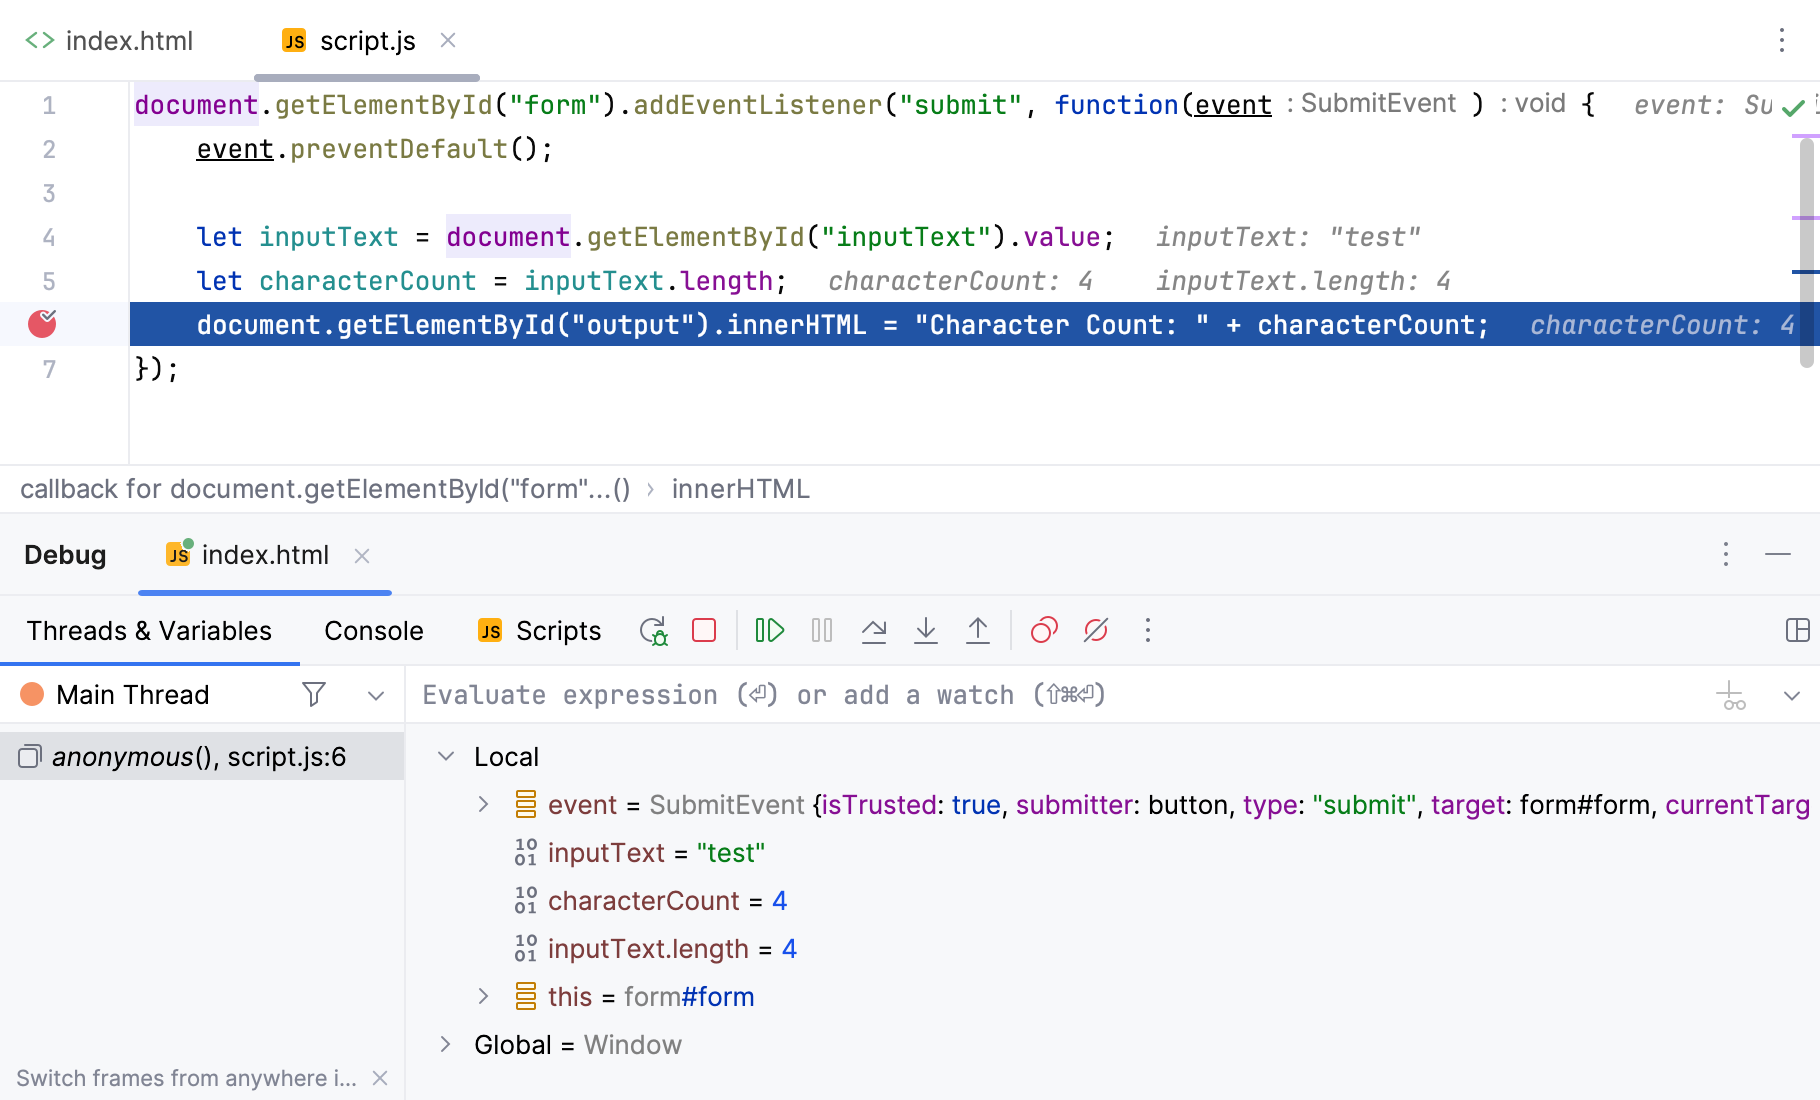
The breakpoint is hit, and PyCharm stops the execution of JavaScript. You can examine the current state in the Debug tool window. For information, refer to Examine suspended program.

Debugging JavaScript on a local development server
When developing Django, Flask, or React web applications JavaScript files are usually served by development servers. Let's see how to debug JavaScript in such cases.
Prepare the project
Create a Django project with an app, for example,
sample_appas described in Create a Django project.Go to sample_app/views.py and add the following view:
def index(request): return render(request, 'index.html')Set the caret to
index.htmlwhich should be hihglighted, press Alt+Enter, and select Create template index.html.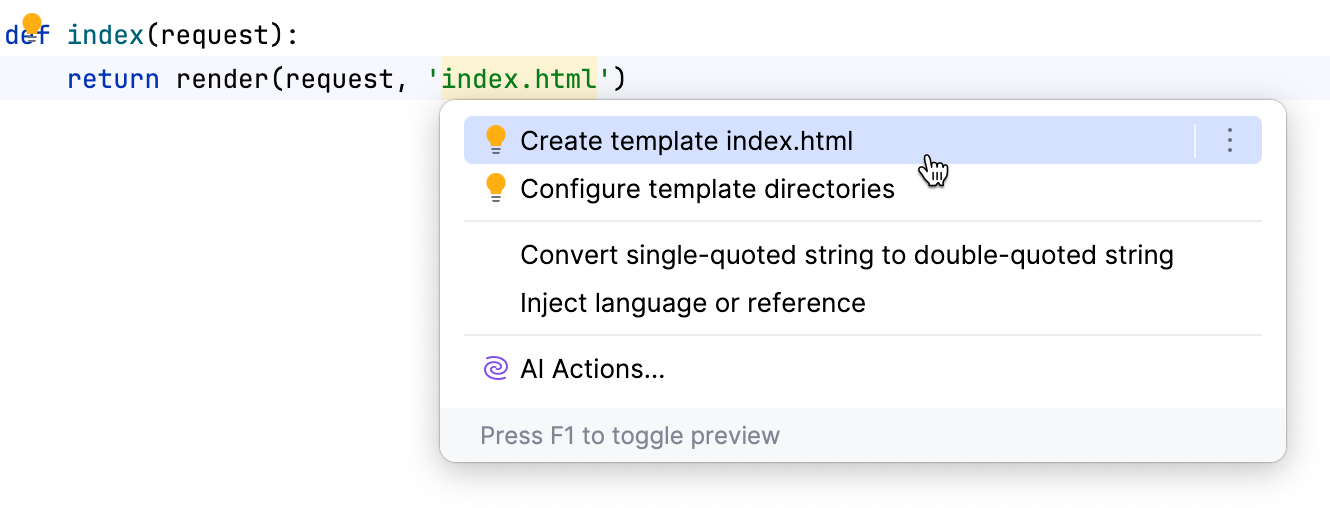
Fill the newly created template file with the following:
<!DOCTYPE html> <html> <head> <title>Character count</title> </head> <body> <form id="form"> <input type="text" id="inputText" placeholder="Enter text"> <button type="submit">Send</button> </form> <p id="output">Character count: </p> {% load static %} <script src="{% static 'script.js' %}"></script> </body> </html>Create a new directory static in the application directory (for information, refer to Create directories). In the new directory, create script.js and fill it with the following code:
document.getElementById("form").addEventListener("submit", function(event){ event.preventDefault(); let inputText = document.getElementById("inputText").value; let characterCount = inputText.length; document.getElementById("output").innerHTML = "Character count: " + characterCount; });Open urls.py, add
from sample_app.views import indexto imports, andpath('', index, name='index'),tourlpatterns. You should get the following:from django.contrib import admin from django.urls import path from sample_app.views import index urlpatterns = [ path('', index, name='index'), path('admin/', admin.site.urls), ]
Now your Django project is ready, and you can start debugging script.js
Set a breakpoint on the line 6 of script.js by clicking the line number.

Run the automatically created Django server run configuration by using the Run widget at the top of the window.

Click
in the Run widget and select Edit Configurations from the dropdown.
In the Run/Debug Configurations dialog that opens, press Alt+Insert and select JavaScript Debug. Provide the name of the configuration and specify the address of the running Django server (for example,
http ://localhost:8000/) in URL.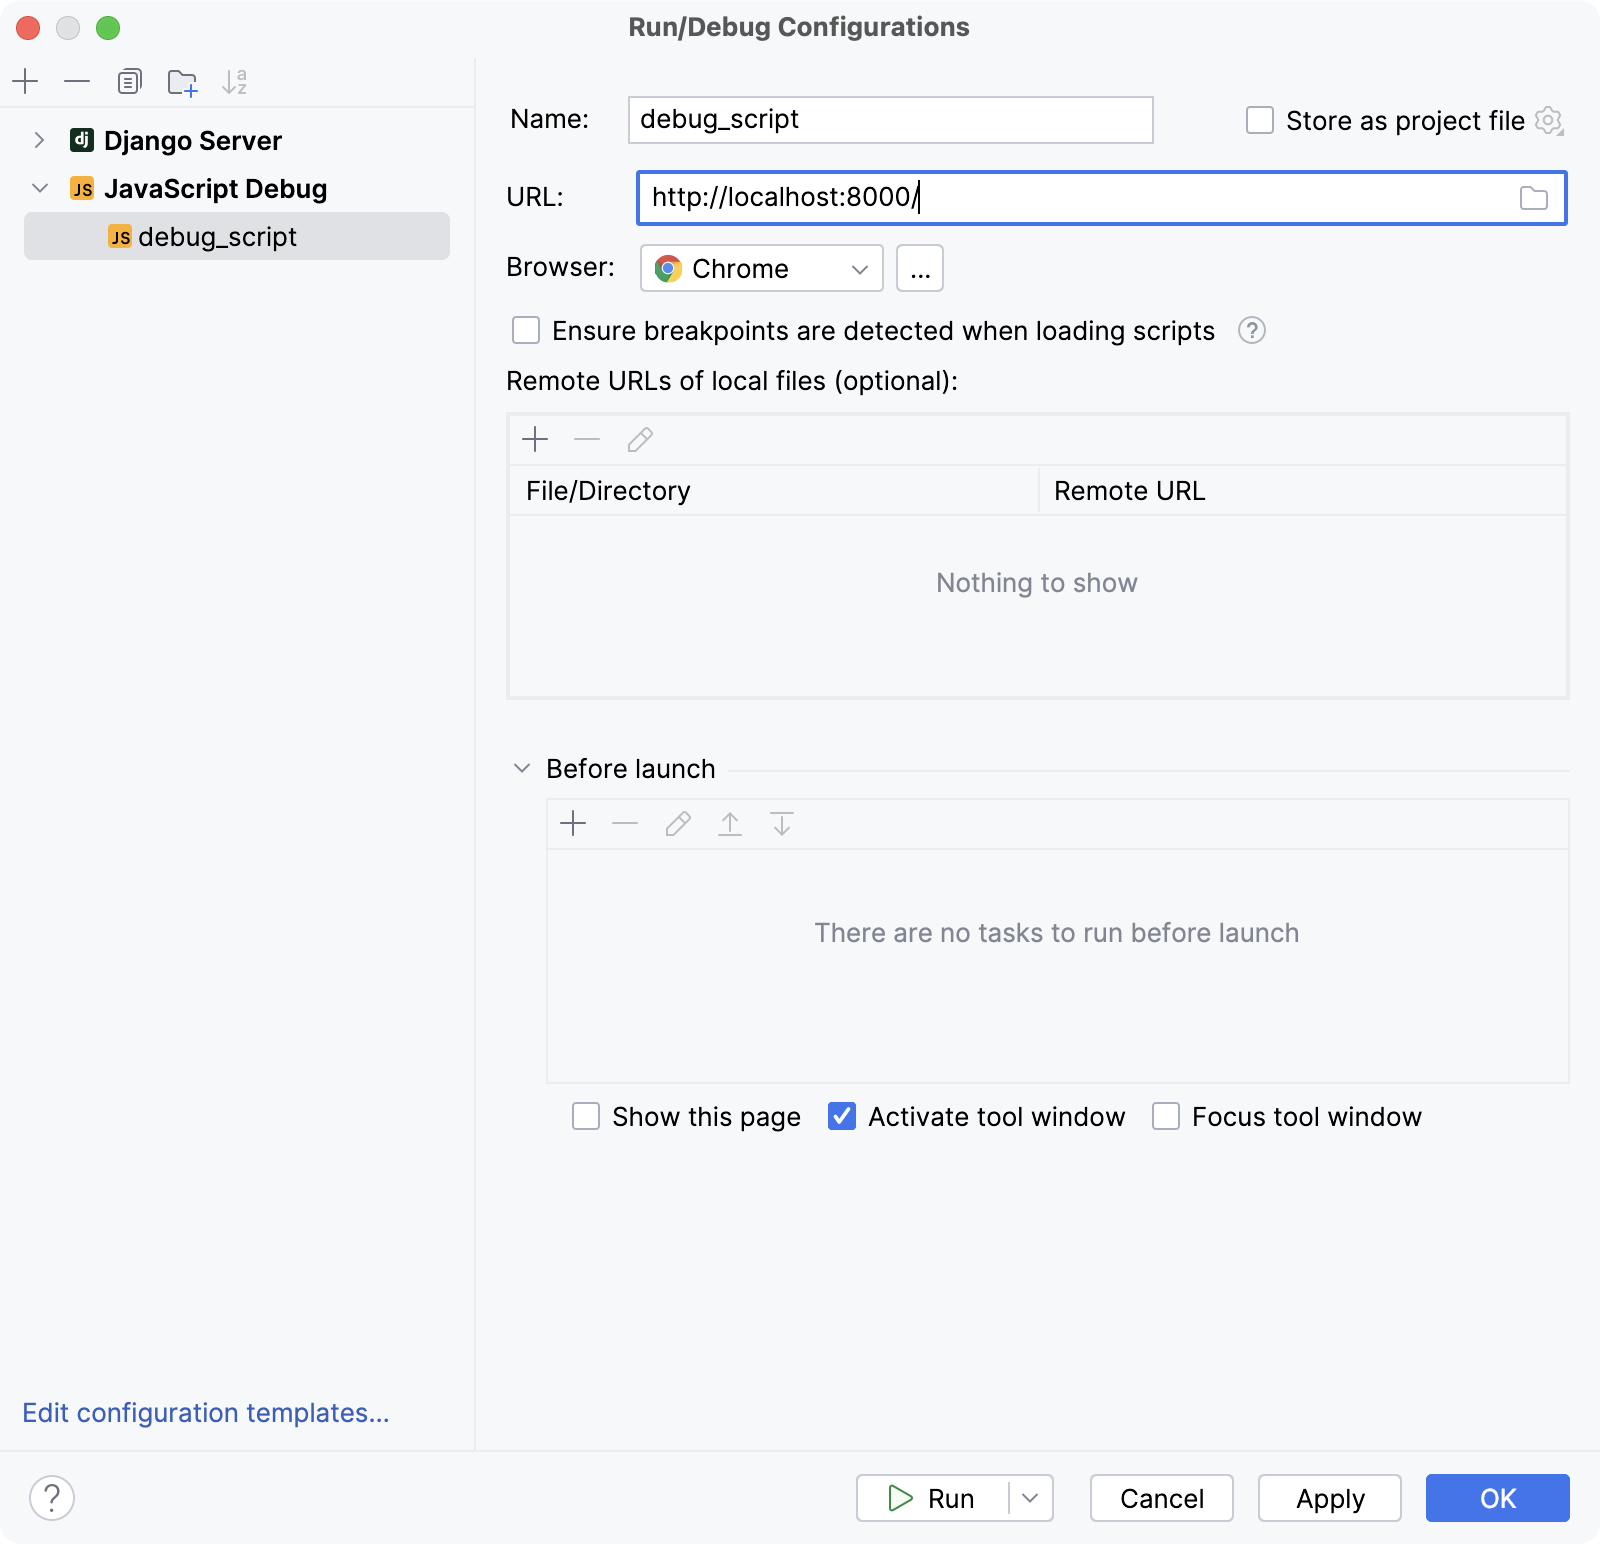
Click Apply to save the configuration and press Shift+F9 to run it in the debug mode.
PyCharm opens the browser with index.html. Type any text in the field and press Enter or click Send.

The breakpoint is hit, and PyCharm stops the execution of JavaScript. You can examine the current state in the Debug tool window. For information, refer to Examine suspended program.
