Overview reports
Information from project reports is aggregated and displayed in several fields.

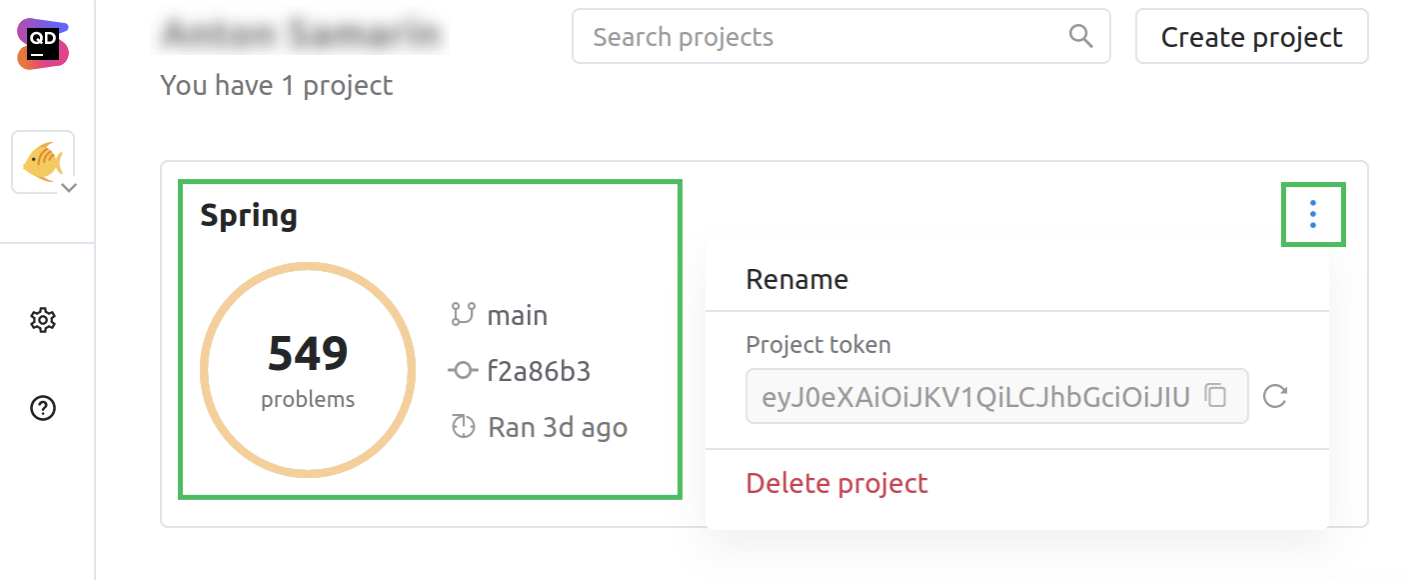
This sample project contains the following fields:
Project name
Branch name
Commit description
Date and time of the latest Qodana inspection
Number of problems detected and severity expressed as a circle. The circle color reflects the severity of the major part of detected problems. You can click this element to open the report
The upper-right corner contains the dropdown list to let you rename the project, copy its token, or delete it from Qodana Cloud
This table shows how Qodana Cloud interprets and displays several reports depending on their metadata.
Branch name | Commit time | Commit hash | Displays |
|---|---|---|---|
The same | The same | N/A | The latest report and overwrites the previous reports |
The same | Different | N/A | Separate reports |
N/A | N/A | The same | Single report |
To see all reports related to the project, click the project name. This will open the Qodana report page.

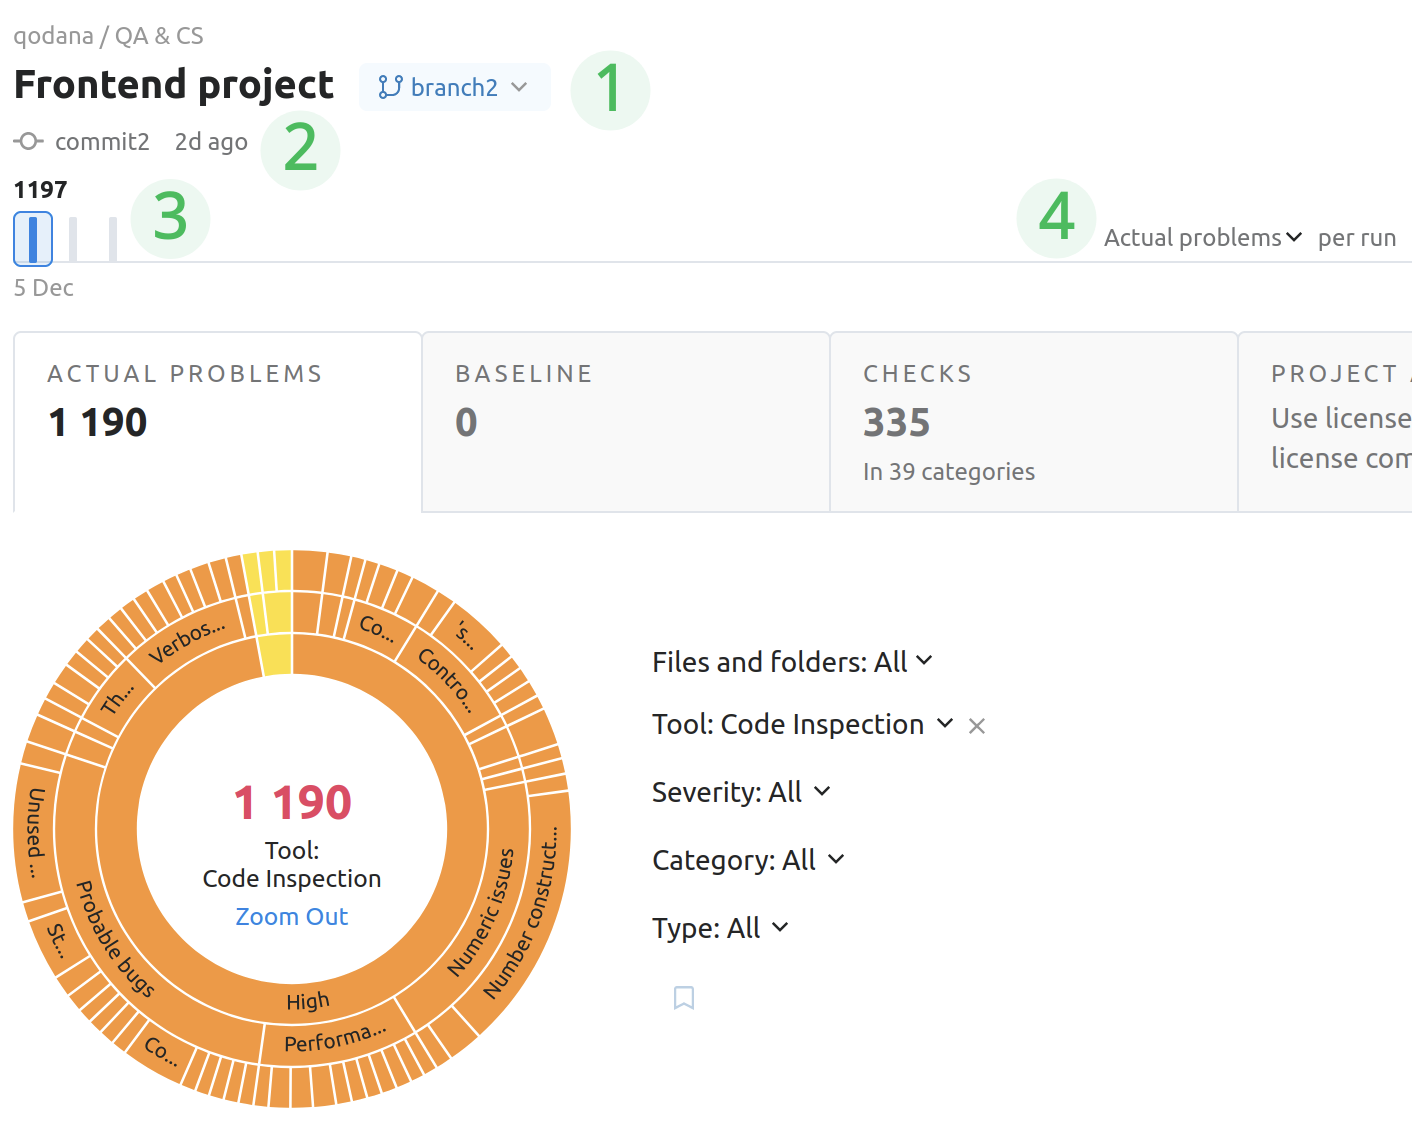
The upper part of this page contains:
1. Branch selector. Using it, you can overview reports for each branch in your project.
2. Commit name and date.
3. Timeline describing the date of inspection and number of problems detected.
4. Selector for overviewing either the absolute number of detected problems, or the number of problems relatively to a baseline set for this project.