User interface overview
The Qodana UI focuses on the single-shot analysis, making it easy to act on results and customize checks.
tip
To learn how to open such reports in your browser, see the Open an HTML report section.
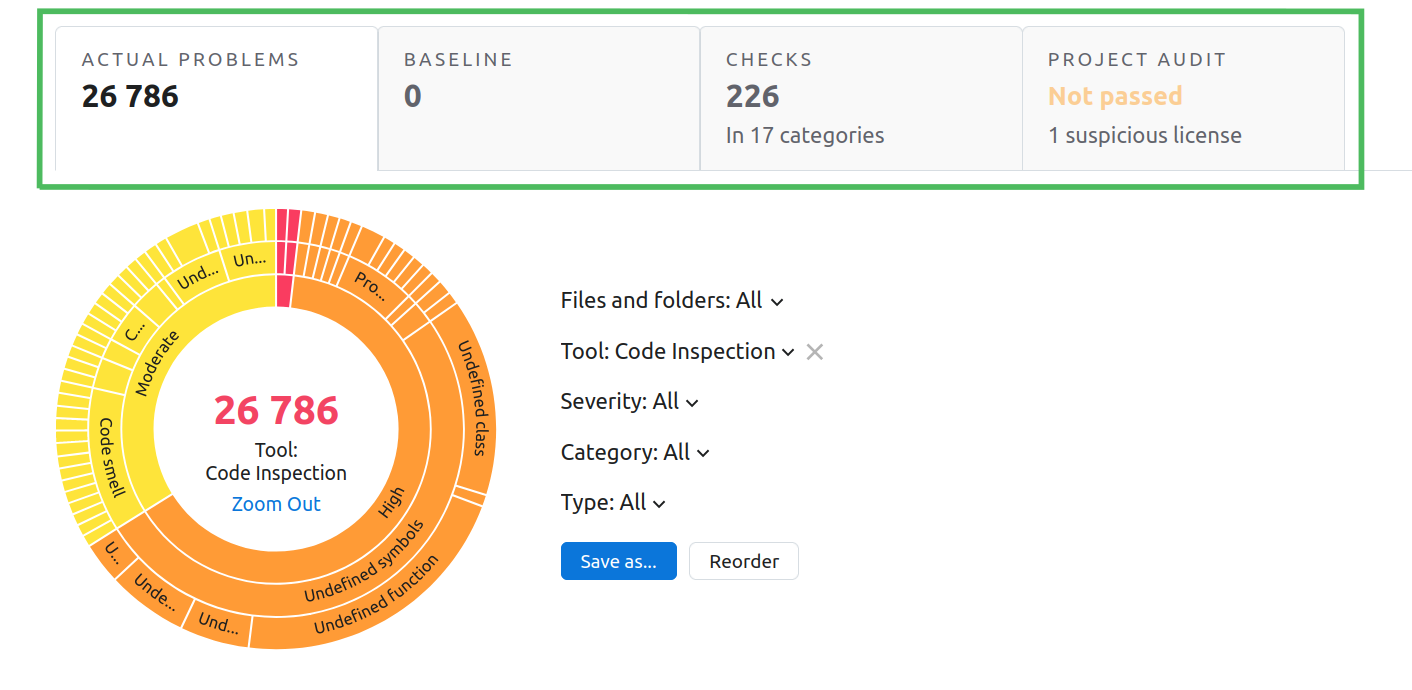
A Qodana report is grouped into tabs.

Each report contains the following tabs:
Actual problems shows the problems that Qodana detected during this run
Baseline lists the problems that remained intact from previous runs
Checks shows the list of inspections and lets you configure them
Project audit describes the problems detected by the License Audit feature
Using this tab, you can overview the problems found during the current Qodana run.

This includes several elements:
The sunburst diagram provides a graphical overview of the problems and allows you to drill down into the cause of the issue.
The filter lets you filter the report data.
Configured filters can be saved using the Save as... button. The Reorder button toggles the editing mode, so you can rearrange the sunburst diagram by dragging its components.
The Problems tab lists and classifies all detected problems by severity, filename, path, category, and type. The Files tab presents problems in the file tree.
The Move to baseline button saves the selected problems to the Baseline list.
Clicking a problem in the list will expand the underlying code fragment to provide the detailed description.
If you have JetBrains Toolbox and IDE integration installed, you can edit the file containing the problem using your IDE. To do it, select your IDE from the dropdown list, and click the Open file in button.
 Gif
GifIf you have several versions of the same IDE, you can select which version will be used to open the file. In the JetBrains Toolbox UI, drag or move the required version of the IDE to the top of the list using the Ctrl + Shift + ↑/↓ shortcut on Windows or Linux, or ⌘ + ⇧ + ↑/↓ on macOS.
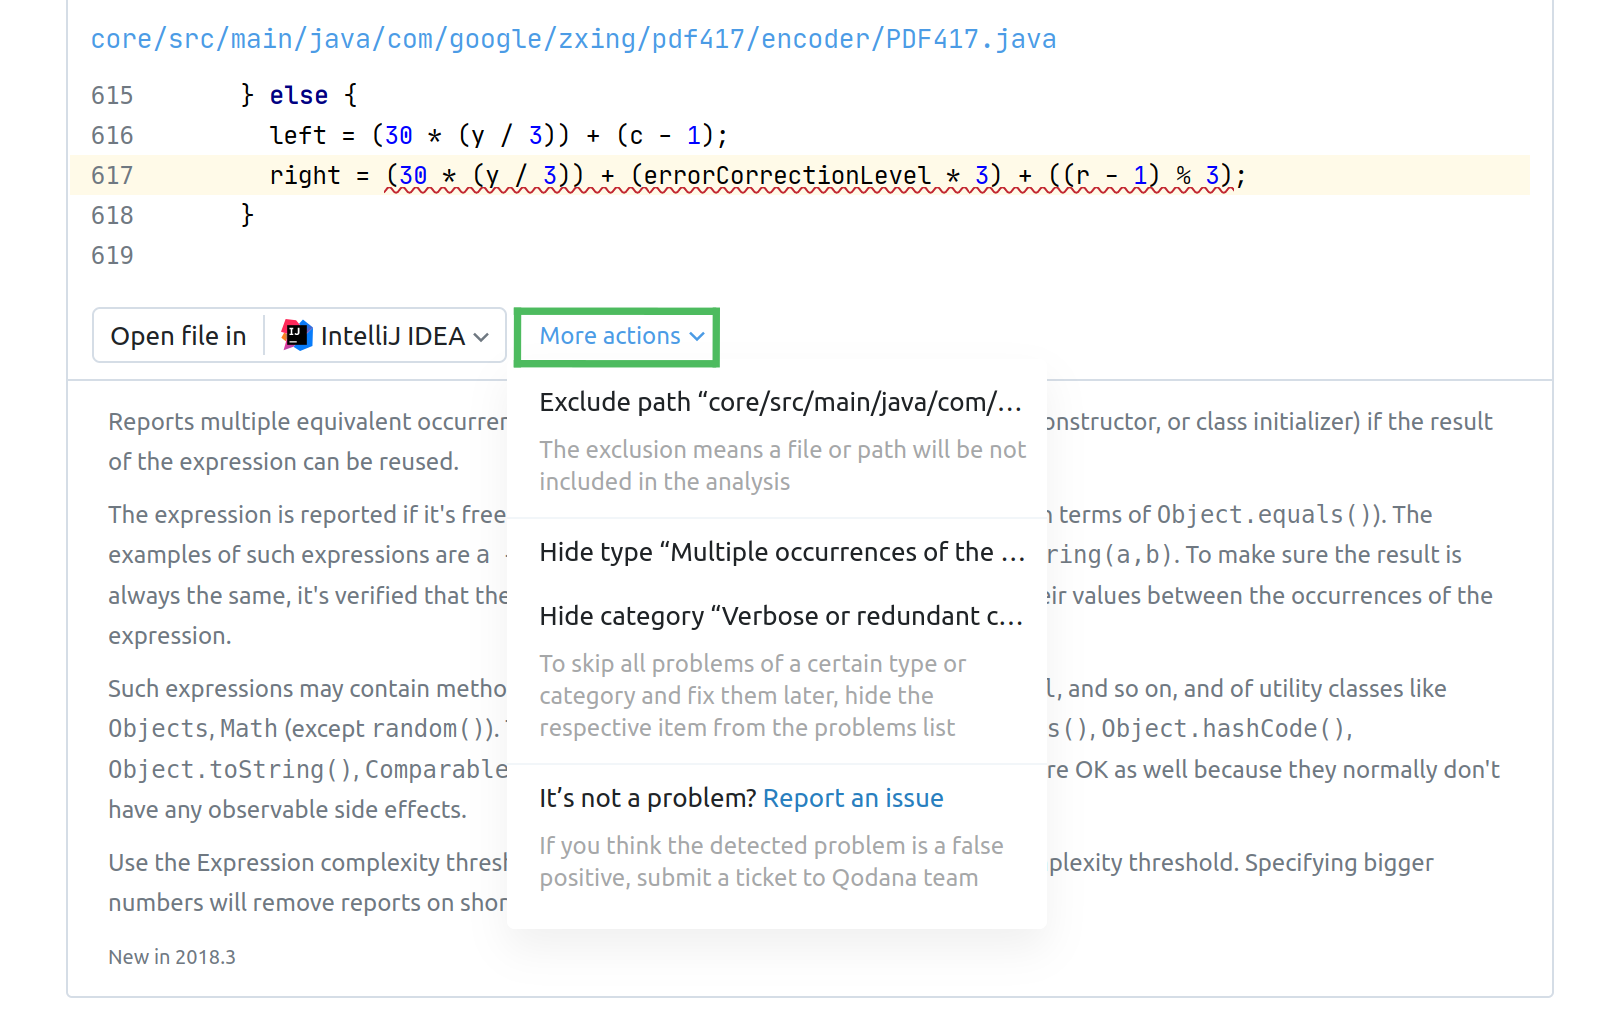
The More actions list provides other options for handling problems, see the Adjust the analysis scope section.
When you click the Move to baseline button in the Actual problems tab, the selected problems will move to this tab.

This tab structure is similar to the Actual problems tab. To enable the baseline feature in future runs of Qodana, download the configuration file and save it to the project root folder. For more information, explore the Baseline section.
The Checks tab lists the inspections and lets you adjust your inspection profile by specifying a set of inspections that Qodana will be using during the next run.

Here, you can study each inspection, enable or disable it. To use this configuration for future Qodana runs, you can download the qodana.yaml file in the Profile configuration section, and save it into your project root directory.
See the Adjust your inspection profile section to learn the best practices.
tip
To learn more about inspection profiles, see the Set up a profile section. You can also edit profile settings in the
qodana.yamlfile.
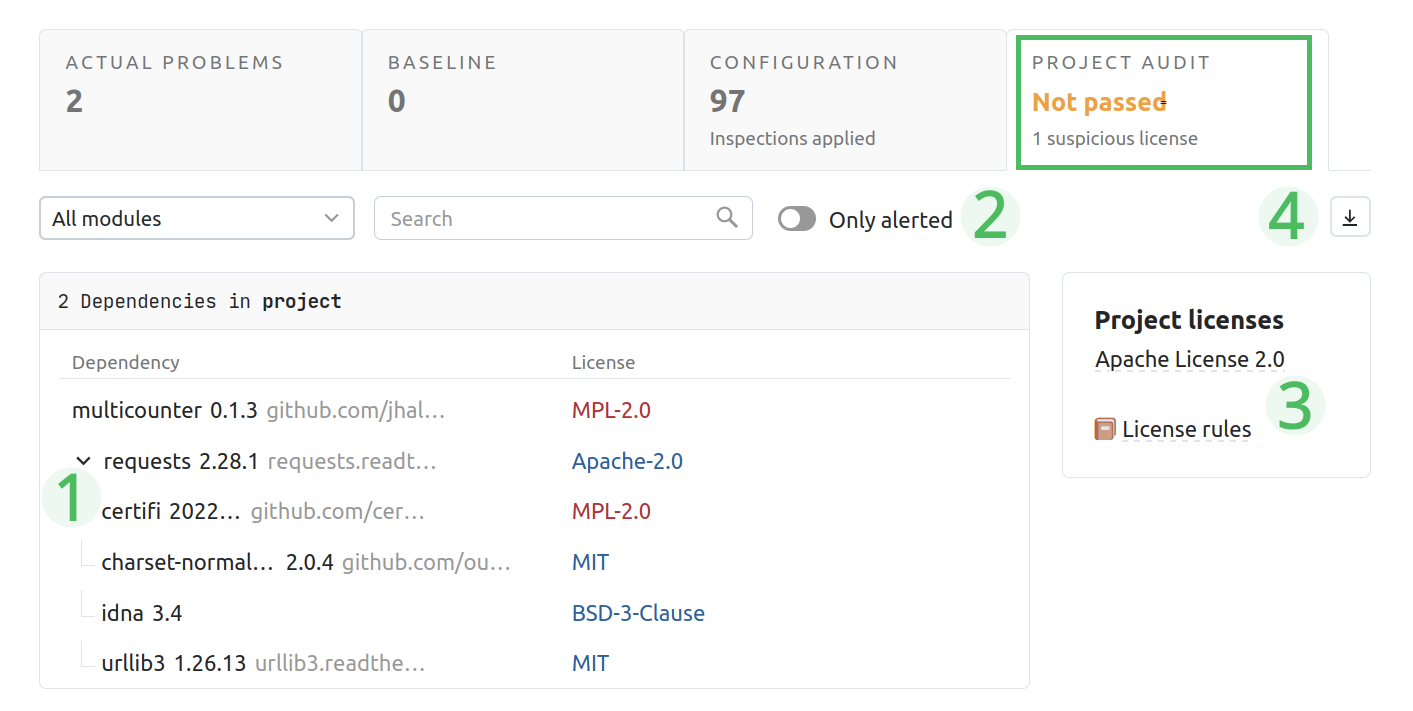
The Project audit tab provides results of inspection by the License audit feature.

License audit inspection results are grouped into a dependency tree.
If applicable, you can expand a specific dependency to overview its dependency tree.
Using Only alerted, you can switch between all project dependencies and dependencies which licenses are incompatible with the project license.
Under Project licenses you can find the list of project licenses. Using License rules, you can overview the rules of license compatibility.
You can download the list of dependencies in various formats.
We believe that the ability to see what was checked is as important as the list of problems found. For example, if you haven't checked for typos, you can be happy to see zero typos in your project. There may be many of them – you just don't check.
tip
Inspection profile can be configured either using the Checks tab, or editing the
qodana.yamlfile.
If the number of problems is manageable, you can fix them and consider the 'problem-free code' goal achieved. We suggest that you follow that goal and fix new problems as soon as they appear.
In case the number of problems is above your expectations, we suggest using the Qodana UI features to examine them. You can then formalize a not-so-big cluster of the problems to fix. Repeat the procedure to work on the next goal, and so on.
When you have no possibility to fix old problems and want to prevent the appearance of new ones, you can run Qodana in the baseline mode.
When viewing a code fragment with a detected problem, you may decide that it is irrelevant. You can make sure that more problems of the same type are omitted in the future. For this purpose, you can edit qodana.yaml or use the Problem and File explorers in the UI as shown below.
Exclude a file or directory from the future analysis
Reason: The analysis of the file containing the error, or even the directory containing this file, doesn't make sense in your project. For example, it's actually not the source code but some generated or downloaded content.
Howto: Under the code fragment view, click More actions and select the necessary option.

OR:
Above the code fragment view, click the file path to navigate to the File explorer.

You can mark the file/directory as Excluded.

Hide a problem type or category from the list of problems
Reason: You suppose that the error type or its category is not relevant or want to get back to it later.
Howto: Under the code fragment view, click More actions and select the necessary option.

tip
If you exclude either type/category or file/directory, the UI will remind you to save the changes if you want to use them in future checks. Download the
qodana.yamlfile and store it under your project root directory.
To reverse the exclusions you made, download qodana.yaml in the Profile configuration section, edit it as necessary, put it in the project root directory, and then run Qodana again with this new configuration.
To learn how to configure Qodana using qodana.yaml, see the Configure profile section.