Taint analysis
Taint analysis lets you trace the flow of potentially harmful or tainted data through a program. It identifies paths where untrusted input or sources might reach sensitive operations or sinks without proper validation or sanitization, which helps prevent security vulnerabilities like SQL injections, cross-site scripting (XSS), command injections, and path traversal. The core goal is to determine if unanticipated input can affect program execution in malicious ways.
Taint analysis is supported by IntelliJ IDEA Ultimate, as well as by the Qodana for PHP and Qodana for JVM linters under the Ultimate Plus license. This feature provides built-in taint rules for the most common categories of OWASP Top 10:2021 vulnerabilities (A01, A03, A07, A08, A10). In addition to the built-in rules, you can configure custom taint rules for your own application or library code, designating specific functions or methods as sources or sinks.
The taint analysis feature runs locally and does not require any external dependencies or services.
How taint analysis works
Tainted data is called a source, while a vulnerable function that may contain a source is called a sink.

Between a source and a sink, tainted data can travel through various passthrough functions which calls are also marked as tainted if the input data was initially marked as tainted. The sanitizer functions can be used to make data safe for further processing through several approaches like data sanitization or data transformation to a safe state.
The projection approach lets you share the taint status across all arguments of a function call. This ensures that the taint status of the arguments is transferred to the return value.
Default behavior in IntelliJ IDEA
If there is no specific configuration available for a library function call, a projection will be applied by default. This means the taint status of the function arguments will be passed to the return value, maintaining the integrity of the taint analysis.
To override the default behavior, you can apply custom configurations to specific function calls.
Before you start
This section explains how you can run taint analysis using IntelliJ IDEA Qodana linters.
IntelliJ IDEA
Before you run taint analysis in your IDE, install the Security Analysis by Qodana plugin. To do it, in IntelliJ IDEA navigate to the Problems tool window and click the Security Analysis tab. On this tab, click the Install plugin button.
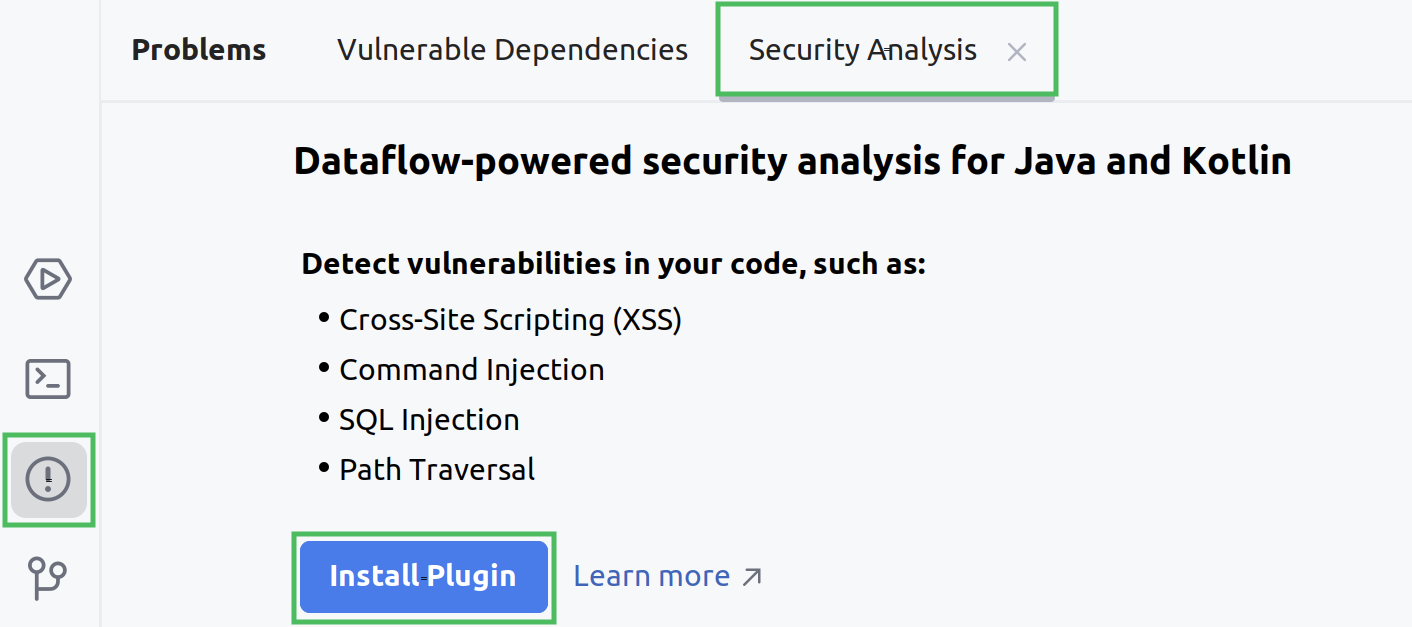
Alternatively, navigate to File | Settings | Plugins and install the Security Analysis by Qodana plugin.
Qodana linters
Taint analysis is available by default once you enable the qodana.recommended inspection profile in the qodana.yaml file as shown below:
Run taint analysis
IntelliJ IDEA
Navigate to the Problems tool window and then click the Security Analysis tab. On this tab, click the Run Taint Analysis button.
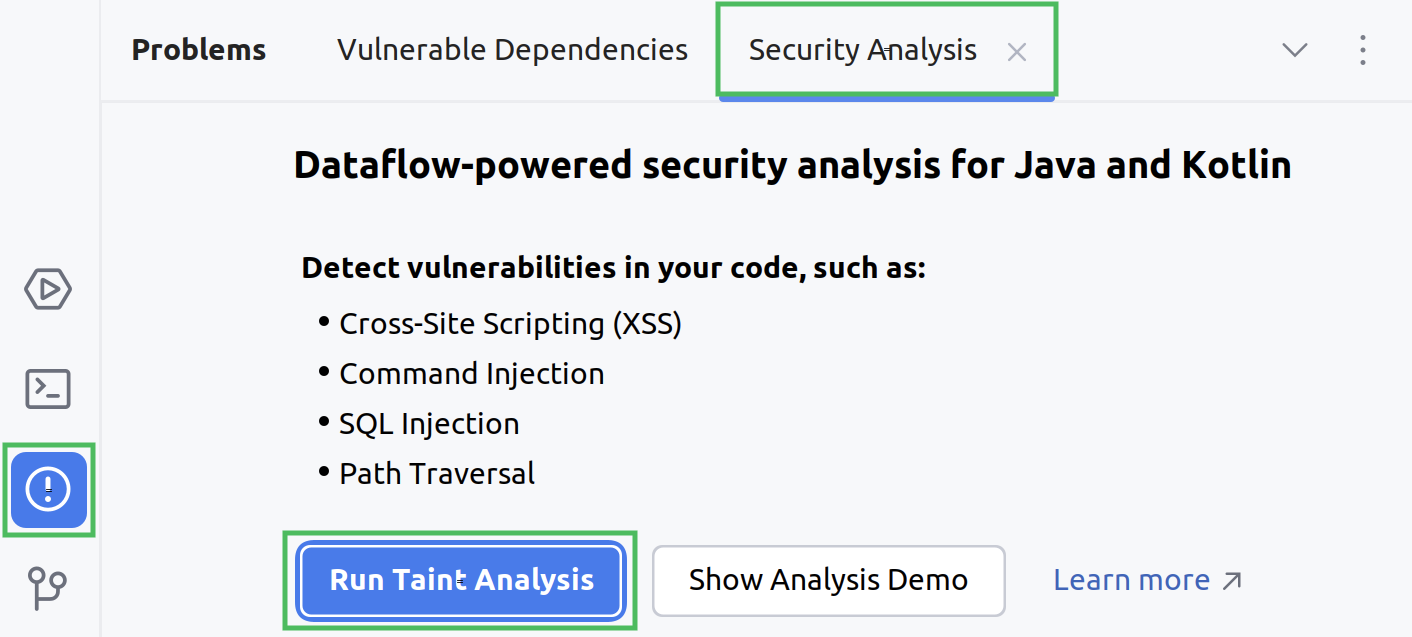
Alternatively, you can navigate to Tools | Security Analysis | Run Taint Analysis.
On the dialog that opens, configure the taint analysis.
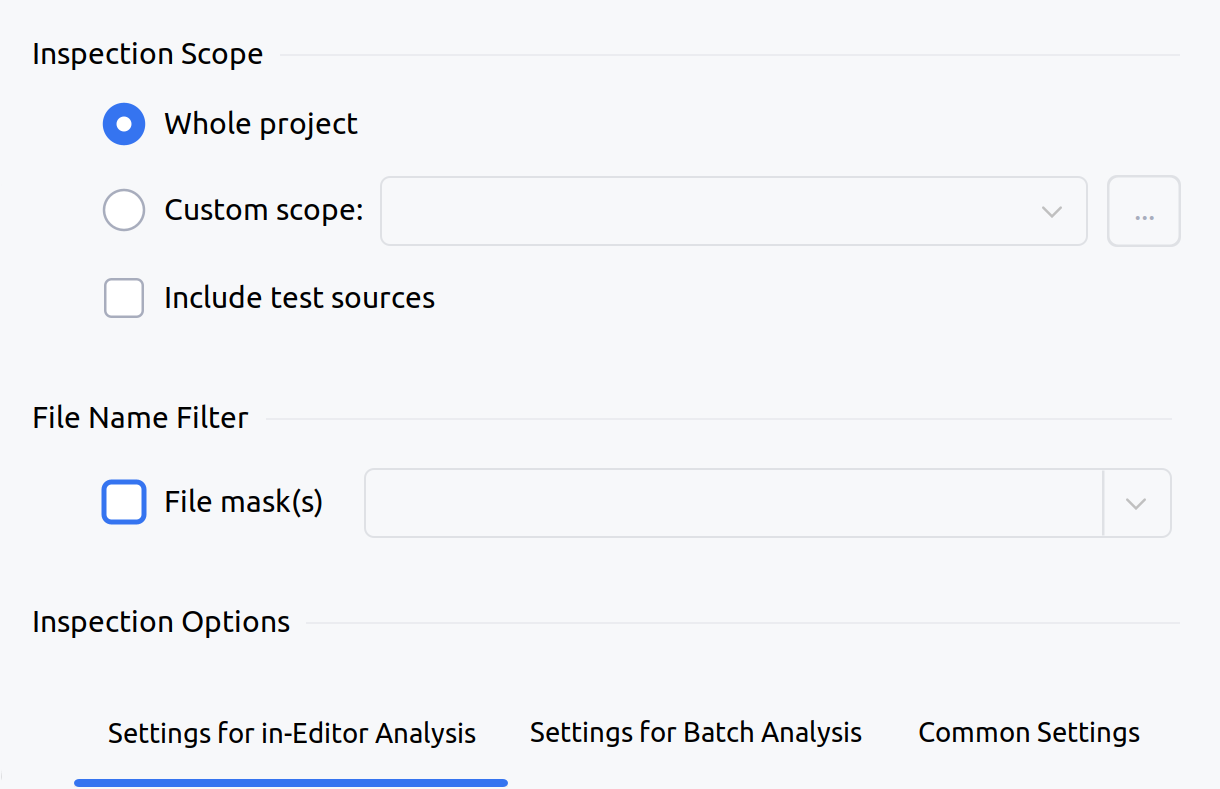
Here you can configure the scope of files that you would like to analyze using taint analysis, as well as file masks for the analyzed files.
The Inspection options group contains several tabs:
Options applied to an opened file in real time.
The field configures analysis depth using the
Current file -> File 1 (Low) -> File 2 (Medium) -> File 3 (High)reference pattern. For example, the setting configures the reference toFile 2from this pattern.The field configures the amount of time that can be allocated for a specific file. The default value is 5000 ms.
Configuration of batch analysis over an entire project.
The field configures analysis depth using the
Current file -> File 1 (Low) -> File 2 (Medium) -> File 3 (High)reference pattern. For example, the setting configures the reference toFile 2from this pattern.The field lets you use caching. While consuming disk space, it can improve analysis performance.
If enabled, the checkbox involves additional analysis techniques that can improve output but will significantly impact performance.
Using the box, you can configure the existing safe classes and define your own.
If no issues were detected, it is possible that the taint analysis configuration is incomplete. Make sure that you defined all necessary sources, sinks, and sanitizers, as explained in the Configure function calls chapter.
Explore results
In your IDE, point to a suspicious code fragment and then click the link to open the Security Analysis tab.
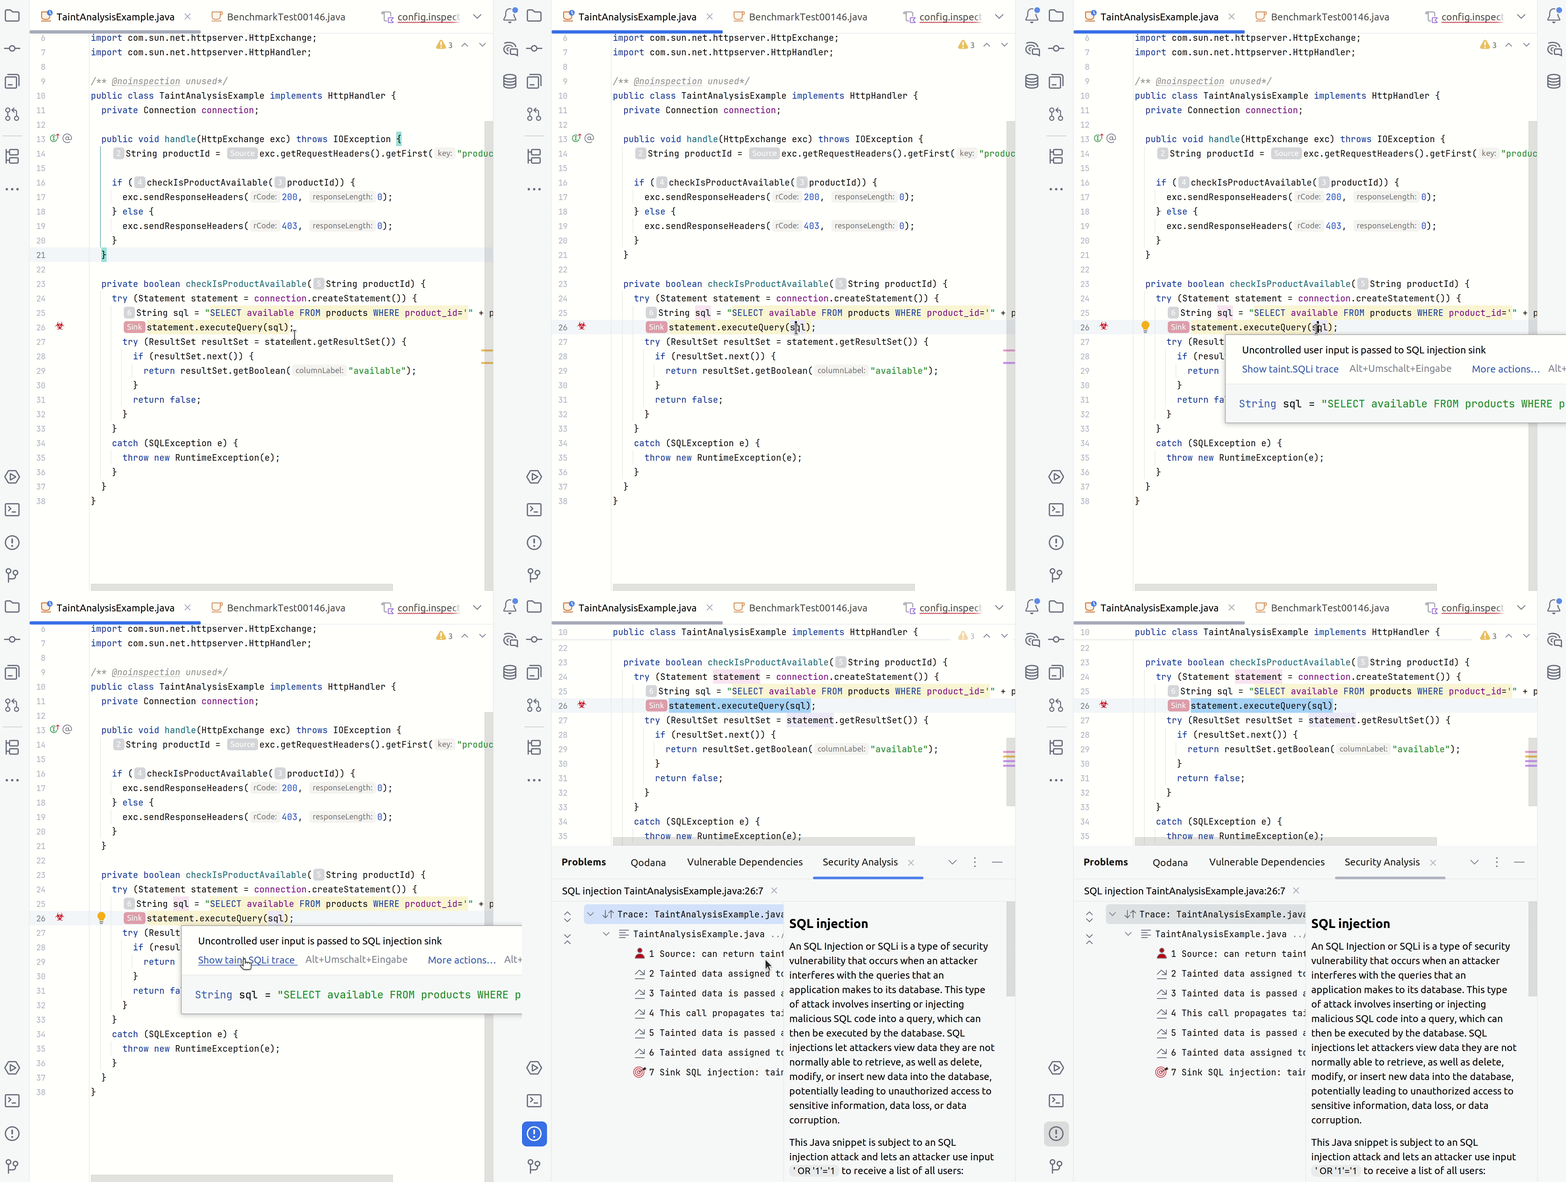
The left part of the tab contains all steps of a taint trace. The right part shows the code fragments corresponding to a specific step. You can click any step to see the source trace to the sink.
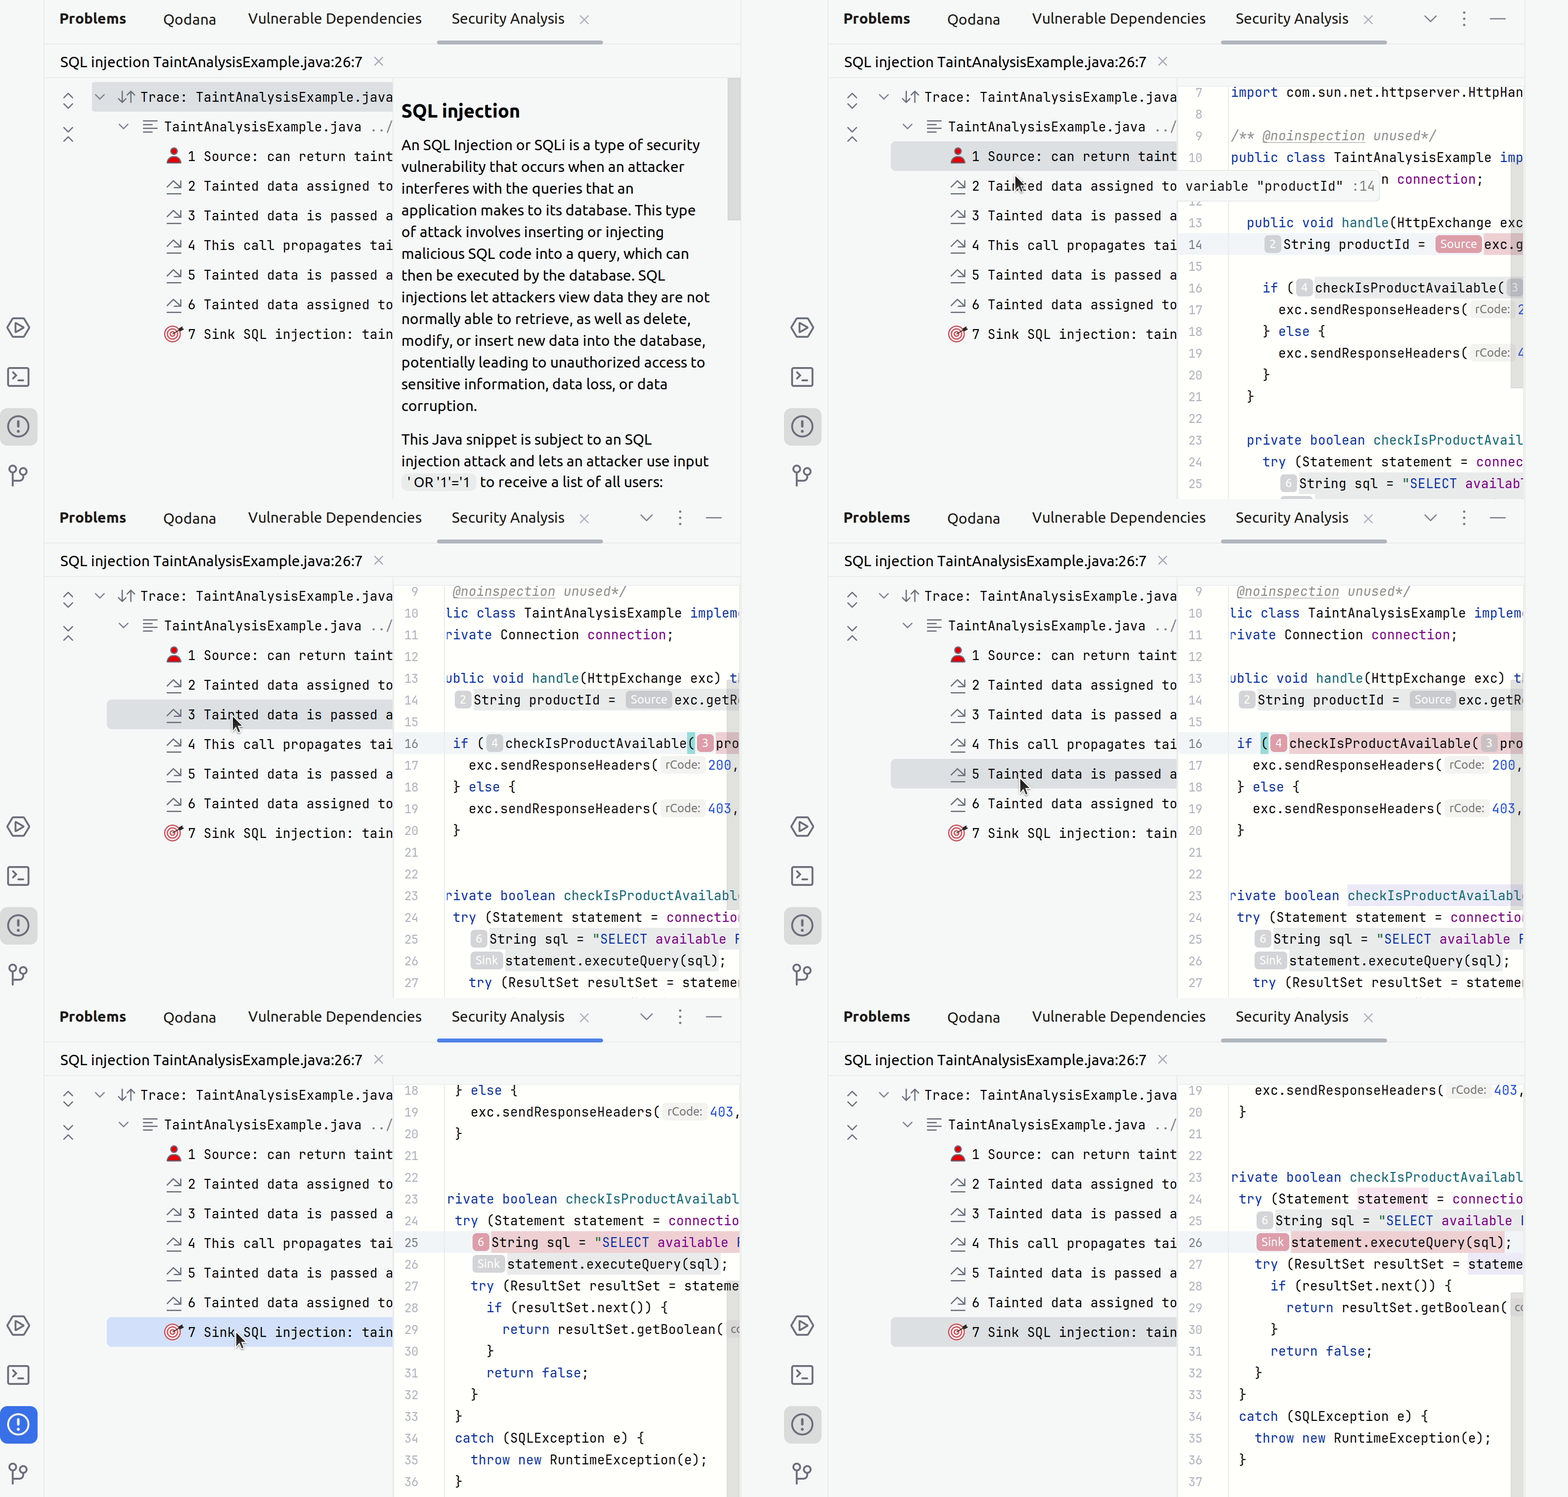
Configure function calls
The analysis of function calls is carried out using the default configuration in case a function call does not match any existing configuration. In this case, the taint analysis builds a projection for this function. The default configuration already covers basic sources, sinks, and sanitizers.
You can configure function calls as your custom sources and sinks as explained below. This example uses the following unconfigured function calls:
java.net.URI.getQuerycan be configured as a source of tainted data to represent a point where potentially untrusted input enters the system.java.io.OutputStream.writecan be configured as a sink where potentially tainted data may be written to an output stream, such as a file or network socket.
In the upper-right part of the tab, click the context menu and then click the link.
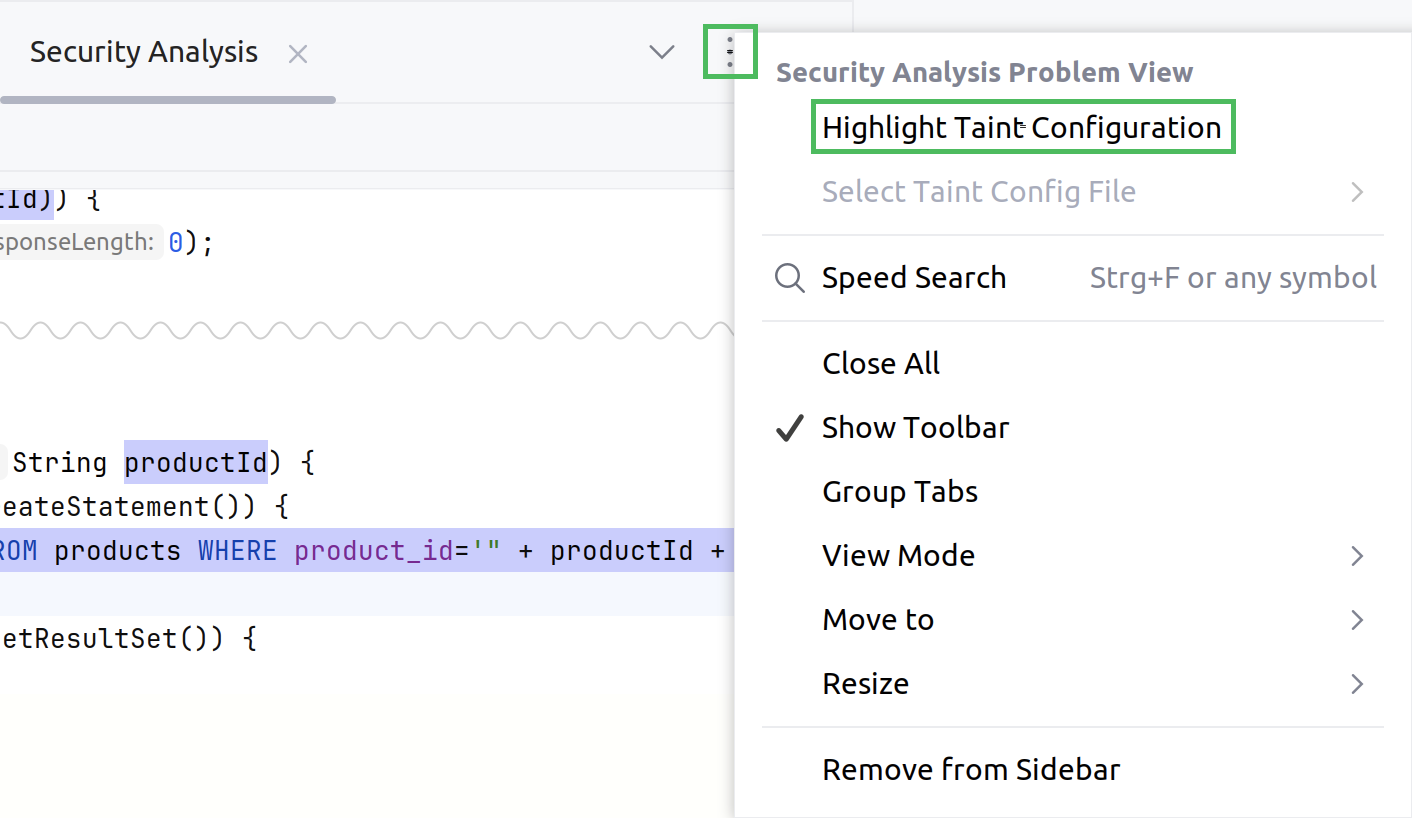
This will open the tab containing current configuration settings applied to all function calls or places where functions are called within the currently opened file.
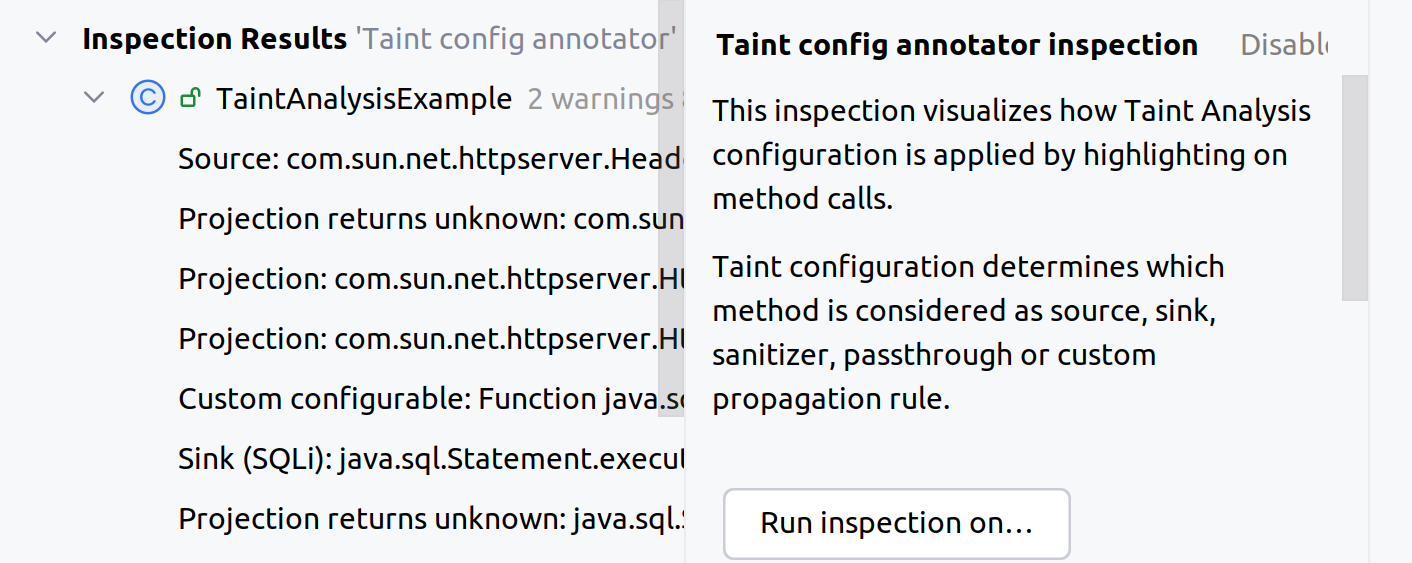
If a function reference matches a specific configuration, the corresponding configuration will be highlighted indicating how it will be treated during analysis. The configuration for function references will appear in the list in the same order as references are located in the file.
In the list of projections, select the projection reference and apply a respective Quick-Fix option.
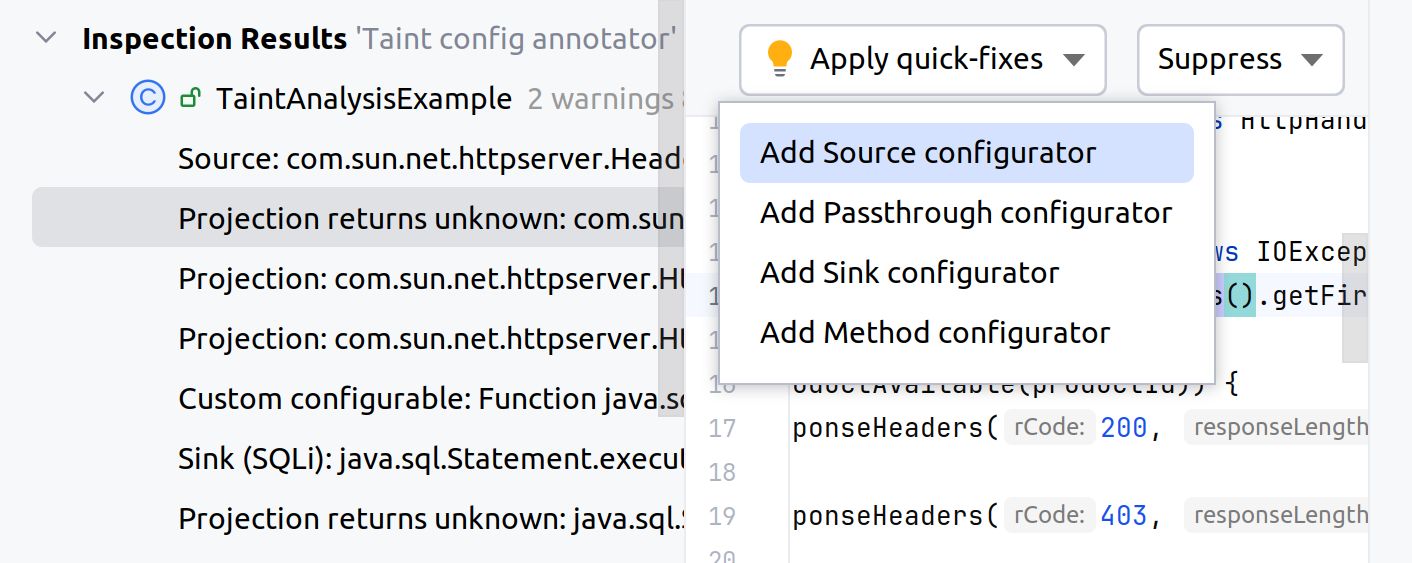
This will create the
inspections/config.inspection.ktsfile for a source, sink, and sanitizer configuration. To ensure consistency of analysis results save this file in the root directory of your project.In the
inspections/config.inspection.ktsfile, assign specific taint rules to a newly added sources and sinks. The configuration from this file is applied to the Taint Analysis inspection when the project opens.For the
java.net.URI.getQueryfunction call as a source, save this configuration to define a point where potentially untrusted input enters a system:source( "java.net.URI.getQuery", "java.lang.String", TaintRule.allRulesList() )For the
java.io.OutputStream.writefunction call as a sink, save the following configuration to ensure that the data reaching the sink are verified for proper sanitization according to the chosen rule to prevent the propagation of unsafe data:sink( "java.io.OutputStream.write", listOf(1), TaintRule.XSS )Once the configuration is written, recompile the
inspections/config.inspection.ktsfile.
Configure the Security Analysis tab
Configure the Security Analysis tab by navigating to File | Settings | Advanced settings. Here, find the Security Analysis section and then configure the Show Problem Tab checkbox.
