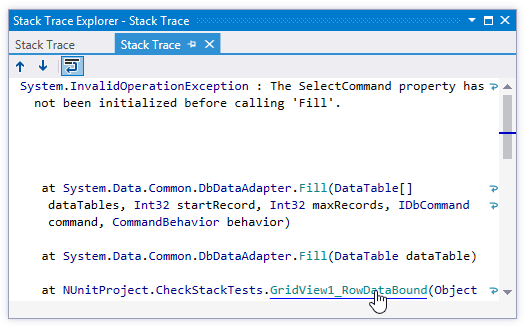
Stack Trace Explorer window
ReSharper | Windows | Stack Traces
ReSharper | Tools | Browse Stack Trace
Control+Shift+E
Stack Trace Explorer displays stack traces from the clipboard and transforms lines within them into clickable links that help you navigate directly to the related code. See Navigate from Stack Trace to Exception for details.
By default, if you copy a stack trace that contains symbols from the currently opened solution and then switch focus to Visual Studio, ReSharper will automatically load it to the Stack Trace Explorer window and bring it to the view. If you do not like this behavior, clear the Auto open external Stack Traces checkbox on the Tools | Stack Trace Explorer page of ReSharper options(Alt+R, O).

Toolbar Controls
| Control | Name | Description |
|---|---|---|
| Previous/ Next Shift+F8/ F8 | Navigate to the previous/next item and scrolls through the source code accordingly. | |
| Toggle wrapping of words | Allows you to enable or disable wrapping of long lines in the sack trace. You can specify the default preference for line wrapping on the Tools | Stack Trace Explorer page of ReSharper options. |
Window tabs
When stack traces open in the window, they are displayed in new tabs, which show up on the left. The previously open tabs move to the right if the width of the window allows, otherwise they unload themselves saving memory - but you can always restore them by clicking the arrow that appears to the right of the tabs and clicking the required tab:

To prevent a tab from unloading, click the pin icon ![]() next to the tab title.
next to the tab title.