Inspection Results window
This tool window displays the results of code analysis and exploration. Different analysis and exploration tools display their results on separate tabs.
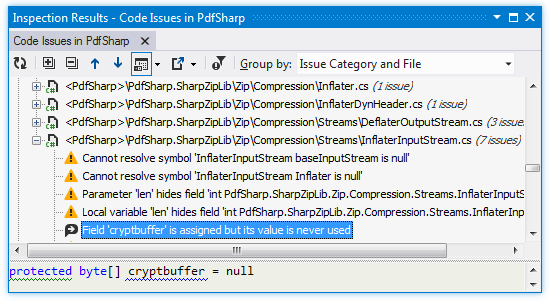
Code inspection results
These results include code issues found in specific scope — for example, issues found when you run code inspection for a project or solution, look for similar code issues, or open issue reports from a file.
All code issues displayed in this window have icons that indicate their severity level:
.png) - Error
- Error.png) - Warning
- Warning.png) - Suggestion
- Suggestion.png) - Hint
- Hint

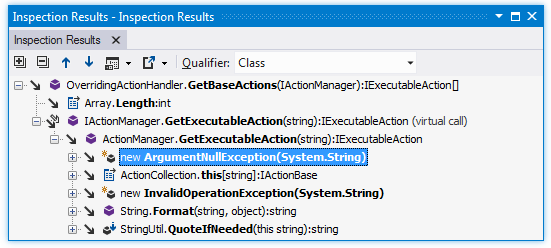
Call tracking results
When you explore incoming or outgoing call chains, the results are displayed in a tree view, for example:

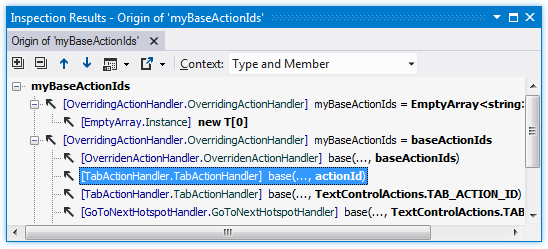
Value tracking results
When you explore value origins and destinations, the results are also displayed in a tree view, for example: 
Window tabs
When inspection results open in the window, they are displayed in new tabs, which show up on the left. The previously open tabs move to the right if the width of the window allows, otherwise they unload themselves saving memory - but you can always restore them by clicking the arrow that appears to the right of the tabs and clicking the required tab:

To prevent a tab from unloading, click the pin icon ![]() next to the tab title.
next to the tab title.
Toolbar Controls
Control | Name | Description |
|---|---|---|
| Refresh | Updates window content to reflect any changes made in the code or externally. |
| Expand All/Collapse All | Expands/collapses all nodes in the current tab. |
| Previous/Next Shift+F8/F8 | Navigate to the previous/next item and scrolls through the source code accordingly. |
| Show Preview Ctrl+P | Hides or shows the pane with a preview of the selected item in the position specified using the list (at the bottom or in the right part of the window). |
| Export | Click this button to export the data currently displayed in the window in text format , or use the drop-down selector to export the data in XML or HTML format. The Export Data dialog that appears, will help you to save the data to a file or copy it to the clipboard . |
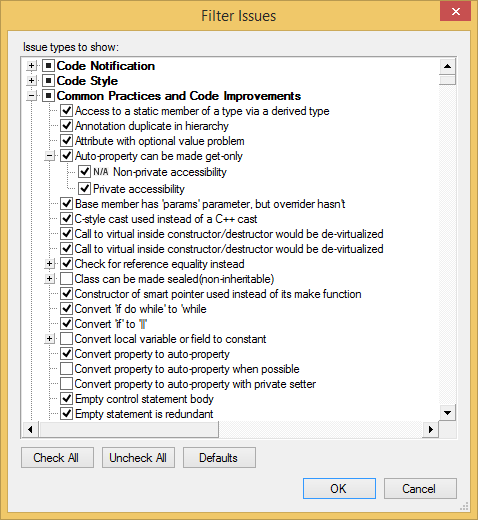
| Filter Issues | Click this button to open the Filter Issues dialog and customize filtering for the displayed code issues  |
Group by | Defines how code issues should be grouped. Several options are provided:
| |
Qualifier | Defines how incoming or outgoing calls should be displayed. Several options are provided:
| |
Context | Defines how value origin or value destination should be displayed. Several options are provided:
|