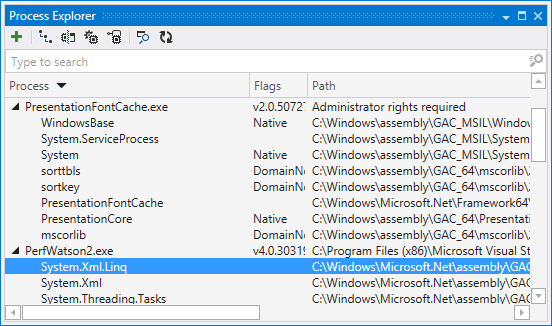
Process Explorer window
The Process Explorer window provides you with the list of currently running processes and allows exploring their modules and decompiling those of them that are .NET assemblies.

Context menu commands
Enable Debugging | This command will generate PDB for selected managed modules or all managed modules in the selected processes. Generation will start immediately to the symbol cache directory specified in Visual Studio options (). If no directory is specified, ReSharper will suggest to automatically add %LOCALAPPDATA%\Temp\SymbolCache as the cache directory. If Visual Studio is in the debug mode, ReSharper will load generated PDB so that you do not have to break your debugging session. |
Add Assembly to Assembly Explorer | Adds the assemblies selected in the Process Explorer tree to the Assembly Explorer window. If you select a process, all assemblies that belong to the process will be added to the Assembly Explorer. Only .NET assemblies loaded from disk files are added, dynamic assemblies and native modules are ignored. |
Open containing folder | Opens the assembly/process executable file in Windows Explorer |
Copy full path | Copies full path to the assembly/process executable file to the clipboard |
Attach | This command will attach Visual Studio debugger to the selected process. |
Toolbar controls
Control | Name | Description |
|---|---|---|
| Add Assembly to Assembly Explorer | Adds the assemblies selected in the Process Explorer tree to the Assembly Explorer window. If you select a process, all assemblies that belong to the process will be added to the Assembly Explorer. Only .NET assemblies loaded from disk files are added, dynamic assemblies and native modules are ignored. |
| Show process hierarchy | Controls whether the process tree reflects the parent-child relationship between processes. If this mode is off, all processes are displayed in a flat list. If this mode is on, child processes are shown inside their parent processes under the Child processes node. |
| Group by CLR | Controls whether the process tree reflects CLR hierarchies. If this mode is off, managed and native modules are shown in a flat list under their parent process nodes. If this mode is on, managed assemblies of each process are grouped by their CLR versions and application domains, and native modules (if the Show Native Modules mode is on) are shown under a separate Native Modules node. This mode is available on Windows Vista or later and requires administrative privileges to work on the full scale. |
| Show native processes | Controls whether the Process Explorer shows native Windows processes. By default the Process Explorer only shows managed processes. If this mode is on, both managed and native processes are shown. Native processes are shown in grey and cannot be added to the Assembly Explorer. |
| Show native modules | Controls whether the Process Explorer shows native modules. By default the Process Explorer only shows managed assemblies. If this mode is on, both managed assemblies and native modules are shown in the tree. Native modules are shown in grey and cannot be added to the Assembly Explorer. |
| Find Process by Window | Helps to find a process by its window. After clicking this button, you can hover the mouse pointer over windows of your desktop and identify the related processes. In this mode, a tooltip appear over each window with the PID and CLR version, and the process is highlighted in the Process Explorer tree. This mode is turned off as soon as you click any mouse button or press any key. |
| Refresh | Updates the displayed snapshot of running processes. |