Call tracking
ReSharper | Inspect | Incoming/Outgoing Calls
ReSharper_CallHierarchyShowIncomingCalls/ReSharper_CallHierarchyShowIncomingCalls
Call Tracking enables you to view and navigate through call chains in your code. ReSharper Call Tracking is a substantial improvement over Visual Studio native Call Hierarchy, thanks to support for events, interfaces, and closures.
In the hierarchy view, ReSharper uses icons to distinguish between different kinds of symbols. If necessary, you can switch between icon sets using the Source code symbol icons theme radio buttons on the Environment | General page of ReSharper options.
tip
Double-click a node in the Inspection Results window to navigate to the corresponding call in the editor.
Place the caret at the name of a method, event, property or constructor.
From the main menu, choose ReSharper | Inspect | Outgoing Calls or press and choose Outgoing Calls in the Inspect This list.
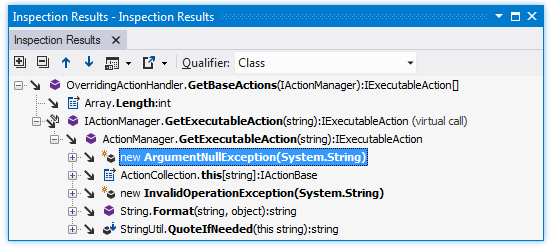
In the Inspection Results window that opens, you can expand the member node to run code analysis on it and to display all members called by the current member. You can also expand each of the child nodes.

Place the caret at the name of a method, event, property or constructor.
From the main menu, choose ReSharper | Inspect | Incoming Calls or press and choose Incoming Calls in the Inspect This list.
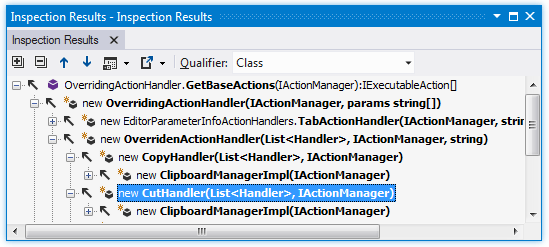
In the Inspection Results window that opens, you can expand the member node to run code analysis and to display all members that call the current member. You can also expand each of the child nodes.

When you get a lot of calls in the call tracking results, you can hide specific calls or the whole branches of the result tree to have a clearer picture of what you are looking for.
Note that when you switch between tabs in the Inspection Results window, the hidden entries are reset.
Right-click the entry that you want to hide and choose Ignore in the context menu.
The entry becomes greyed out but it is still visible and searchable. Also the Show Ignored Usages
.png) button appears on the toolbar.
button appears on the toolbar.To hide or show ignored entries, toggle the Show Ignored Usages
.png) button.
button.To reset ignored entries, toggle on the Show Ignored Usages
.png) button, right-click a greyed-out item, and choose Undo ignore in the context menu.
button, right-click a greyed-out item, and choose Undo ignore in the context menu.
This feature is supported in the following languages and technologies:
The instructions and examples given here address the use of the feature in C#. For more information about other languages, refer to corresponding topics in the Languages and frameworks section.