Debugging Assistance in C++
With ReSharper, you can improve your debugging experience in the editor.
Inline values
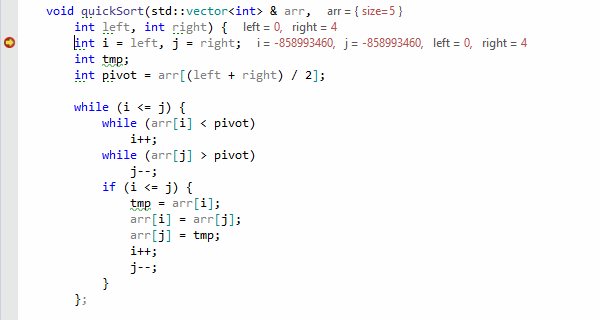
When you suspend execution while debugging your C#, VB.NET, or C++ code, you can see the values of local variables, current line expressions, and function returns right in the editor, next to the corresponding code lines.
This feature provides immediate feedback during debugging sessions, which means that often you don’t even have to consult the Watches or Autos tool windows.
Inline values are enabled by default, but you can configure, which kinds of values should be displayed using the page of ReSharper options Alt+R, O.

ReSharper is careful to evaluate only those expressions that do not have side effects. At the moment, expression evaluation is limited to references, constants, member access, and built-in subscript operators. Subscript operators of std::vector and std::array are also evaluated as an exception.
Note that ReSharper calculates inline values using the Visual Studio debugger engine to evaluate expressions, which means that Natvis files with user-provided visualization rules are automatically supported.
Searchable DataTips
ReSharper can optionally replace the Visual Studio DataTips with its own DataTips, which have a number of distinctions:
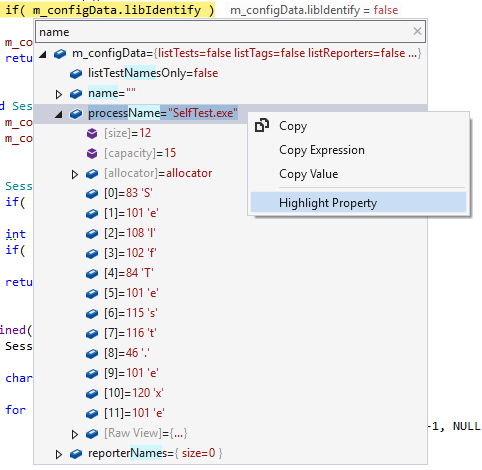
You can search for specific values in the current suspended-execution context. To do so, just start typing when the focus is in the DataTip. Note that the search will only find values in expanded nodes.
The DataTip disappears not when you remove the mouse pointer, but when you click anywhere outside the DataTip.
You can mark members of a class which will be used to construct a custom presentation string for objects of this class. To do so, expand the type in the DataTip, right-click the desired data members and choose Highlight Property:

To use ReSharper DataTips instead of Visual Studio DataTips, enable the corresponding option on the page of ReSharper options Alt+R, O.
Step filters
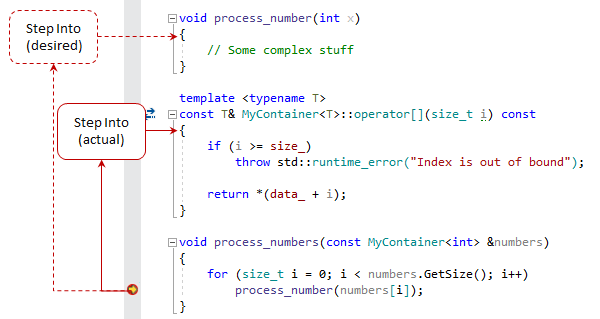
Why do you need step filters? Well, the illustration below explains pretty much everything:

Some functions never need to be stepped into because they are either very simple or very well tested. But the problem is that the debugger cannot tell which functions are worth debugging and which are not, and therefore Step Into will not miss any function on its way.
With ReSharper, you can maintain step filters — a list of function masks that tells the debugger what should be skipped on stepping. By default, this list includes a lot of library functions and it can be extended with your own function masks.
Custom step filters as well as any modifications to default filters are saved using the mechanism of layered settings, which means that modifications to step filters saved in the Solution team-shared settings layer can be shared with your teammates.
You can study and configure step filters on the page of ReSharper options Alt+R, O.
While debugging, you can quickly add a function to the filters: press Alt+Enter on that function, and it will be added to the filters:

By default, this action saves the filter using the smart save logic, but you can also use the action's submenu to choose the settings layer where the filter should be saved.
You might remember that Visual Studio has a built-in way to customize stepping behavior in C++, which is a part of C++ Just My Code. However, no user interface is provided for configuring this feature from the IDE, so you need to manually edit .natstepfilter XML configuration files to change existing or add new rules. Furthermore, there is no way to add solution-specific rules, since the configuration files are global.