Navigate breakpoints
ReSharper | Navigate | Breakpoints…
(ReSharper_GotoBreakpoints)
With ReSharper, you can quickly jump to any breakpoint/tracepoint in your solution and study all breakpoints in a dedicated tool window, which features grouping, search, preview, and symbol names.
tip
You can see, toggle, and enable/disable breakpoints in the Find Results window.
Press or choose ReSharper | Navigate | Breakpoints… from the main menu. Alternatively, you can press , start typing the command name in the popup, and then choose it there.
In the Breakpoints popup that opens, you will see all breakpoints defined in your solution.
Do one of the following:
Click the desired breakpoint to go to the corresponding line in the editor.
Select the desired breakpoint by pressing Up and Down and then press Enter to go to the corresponding line.
To find a breakpoint, start typing the name of the containing project, class, member, or contents of the line where the breakpoint is defined. The input field is case-insensitive and allows you to type any parts of the above-mentioned items separated by whitespaces:

To remove a breakpoint, select it in the list by pressing Up and Down and then press Delete.
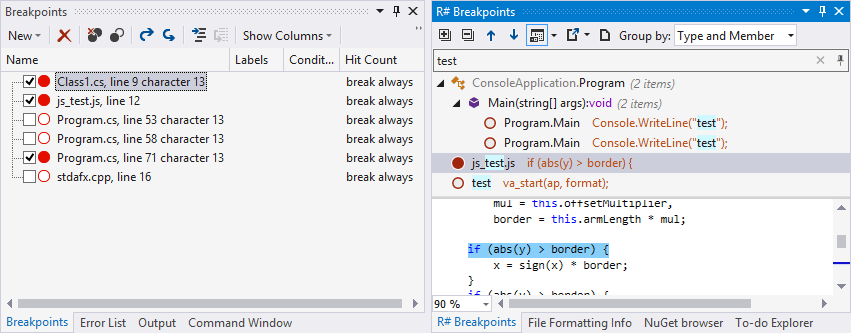
ReSharper also brings its own R# Breakpoints window, which you can use as an alternative to the Visual Studio's native window — you can start typing to search for a breakpoint or use context menu to enable/disable or remove breakpoints. You can check how the both differ from each other on the screenshot below.

To display the R# Breakpoints window, open the Breakpoints popup as described above, and then click Show in Breakpoints window ![]() , press Shift+Enter or + on the numeric keypad.
, press Shift+Enter or + on the numeric keypad.
This feature is supported in the following languages and technologies:
The instructions and examples given here address the use of the feature in C#. For more information about other languages, refer to corresponding topics in the Languages and frameworks section.