Work with unit tests in current document
Discover tests in the current document
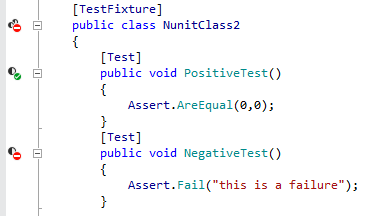
ReSharper discovers unit test classes and single unit tests of all supported frameworks right in the editor and adds the corresponding action indicators next to each item in the editor:

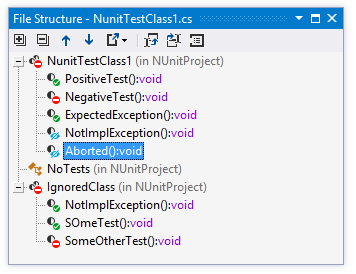
... and in the File Structure window window:

| The method is a unit test and you can run and debug it. |
| The class is a unit test class and you can run and debug containing tests. |
| The unit test has passed during the last execution. |
| Tests in the unit test class have passed during the last execution. |
| The unit test has failed during the last execution. |
| At least one test in the unit test class has failed during the last execution. |
| The unit test was ignored during the last execution. |
| All tests in the unit test class were ignored during the last execution. |
Run, debug, or cover tests in the current document
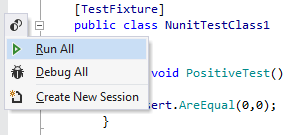
There are several ways to run, debug, or cover unit tests in the current document. You can use action indicators, main menu, or shortcuts:
To run, debug, or cover a single test or all tests in a test class, click the action indicator next to it or place the caret at the test /test class and press Alt+Enter. In the action list, choose Run/Debug for a test or Run All/Debug All for a test class.

Alternatively, you can use the Run Unit Tests
.png) Control+T R/Debug Unit Tests
Control+T R/Debug Unit Tests .png) Control+T D commands, which are also available in the main menu () and in the context menu. These commands work differently depending on the caret position or selection in the editor:
Control+T D commands, which are also available in the main menu () and in the context menu. These commands work differently depending on the caret position or selection in the editor:To run, debug, or cover a single test or all tests in a test class, place the caret at the test /test class name, or anywhere inside its declaration in the editor , or else, select it in the File Structure window window .
To run several tests, select the desired tests in the editor or in the File Structure window window .
To run all tests in the current file, either select all or place the caret outside test classes.
Whatever way you choose to run, debug, or cover tests, you will see the execution progress, results, and output in the Unit Test Sessions window. If there is an open unit test session, the executed tests are added to that session. If there are no test sessions or the existing ones are locked, then a new tests session is created.
If necessary, you can always re-run the tests that you executed last by pressing Control+T T or choosing from the menu.
Inlay hints for test data attributes
To help you understand how the arguments of test data attributes are used in test methods, ReSharper displays parameter name hints for the following attributes:
NUnit's
TestCaseattribute,xUnit's
InlineDataattribute,InlineAutoDataattribute fromAutoFixture.NUnit3andAutoFixture.Xunit2.

If you want to disable these inlay hints, use the corresponding checkboxes on the page of ReSharper options Alt+R, O