Error Stripe and Status Indicator
Error stripe and Status Indicator visualize the results of the design-time code inspection in the current file and navigate between code issues. Also, the error stripe displays special marks for other features, for example when you highlight usages in the current file.
The error stripe is not shown and the status indicator shows the pause icon ![]() if:
if:
The editor displays decompiled code.
Error stripe
Error stripe is a sidebar integrated into the editor scroll bar. The Error stripe can represent the following items as individual markers:
Code issues found by JetBrains Rider's design-time inspection.
Markers have different colors representing kinds of corresponding items. Colors may vary between various color schemes but you can configure error stripe colors for each item kind individually.
The position of a marker on the bar indicates the relative position of the corresponding item in the file. You can get popup tips for each item by placing the mouse pointer over markers, and you can navigate directly to relevant lines of code by clicking on them.

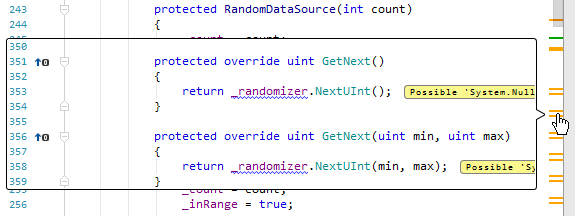
If the code corresponding to the marker is outside the visible editor area, and Show code lens on scrollbar hover is enabled on the page of JetBrains Rider settings Ctrl+Alt+S, JetBrains Rider will display this code fragment in a popup when you hover the mouse over the marker: 
Configure the appearance of the error stripe
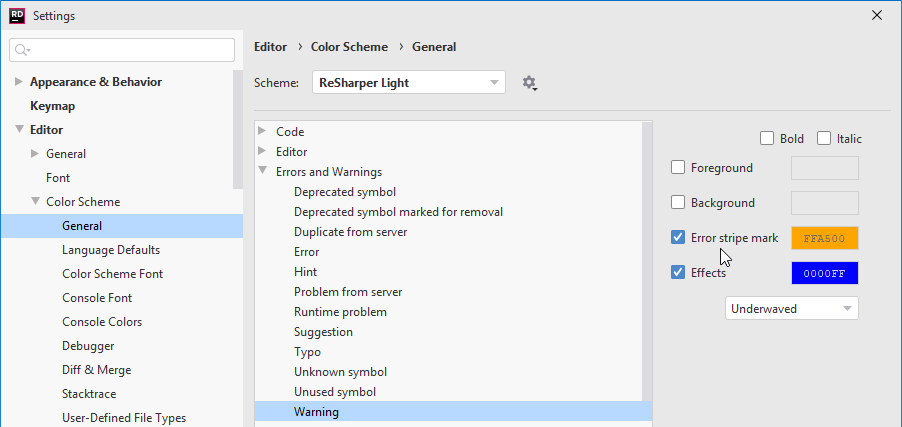
Press Ctrl+Alt+S or choose (Windows and Linux) or (macOS) from the menu, then choose on the left.
Choose an item in the list and use the Error stripe mark checkbox to show or hide it on the error stripe; use the color picker next to it to choose the color to represent the item on the error stripe.

If you are not sure how to find the item marked on the error stripe, you can locate its settings in the following way:
Click the error stripe marker so that your caret gets to the related item in the editor.
Press Ctrl+Shift+A, start typing
jump to colors and fontsand pick this command in the list.You will see all appearance properties that affect the item and its presentation on the error stripe. In the example below, the yellow error stripe mark is displayed for the Warning.

When you pick this property, you will get directly to its settings.
Status indicator
Status indicator — by default, is shown as widget with number of issues in the top-right corner of the editor, or in the Compact View mode, as an icon at the top of the error stripe. It shows the status of the code inspection in the current file. When you click it in the compact view mode a popup appears to show the total number of errors and warnings in the current file.

Context menu of the status indicator
You can also right-click the status indicator and then click ![]() to use the following commands and options from its context menu:
to use the following commands and options from its context menu:
| Configure Inspections | Opens code inspections settings, where you can change severity levels of specific inspections or disable them altogether. |
| Show Auto-Import Tooltip | If this option is selected, a popup that suggests importing namespaces in C# and VB.NET shows up if one or more non-imported types are detected in the file:  The option is synchronized with the Show the 'Import namespace' action using popup option on the page of JetBrains Rider options. |
| Compact View | When enabled, the status indicator is shown as a single icon at the top of the error stripe. |
Meanings of status indicator icons
Status Indicator can have different icons with the following meanings:
| | Whenever you see a red marker, it means that the file contains errors that would either prevent the project from compiling or lead to exceptions in runtime, unless Treat warnings as errors is enabled in project properties. |
| | A yellow marker means that there are some warnings, but no errors that would prevent the project from compiling. |
| | A green marker means that your code doesn't contain errors or warnings, but there still can be code issues with minor severity levels (Suggestion or Hint). |
| OFF | The file is excluded from code inspection. You can include it back thus enabling the code inspection by pressing Ctrl+Alt+Shift+8. |