Find Code Issues in Specific Scope
Design-time code inspection is a great help when you are coding in the editor or reviewing specific files. However, JetBrains Rider also allows you to run static code analysis in the whole solution or narrower scope and examine the results in a friendly view.
Start code inspection
Inspect code in solution, project or in a custom scope
Decide whether you want the results of the solution-wide inspections (for example, unused public members) to be included in the report. If you want these results to be included, enable the solution wide-analysis. Note that when solution-wide analysis is enabled, JetBrains Rider has to analyze the whole solution even if you need to inspect a single project, so be prepared that it takes more time.
Do one of the following:
In the main menu, choose
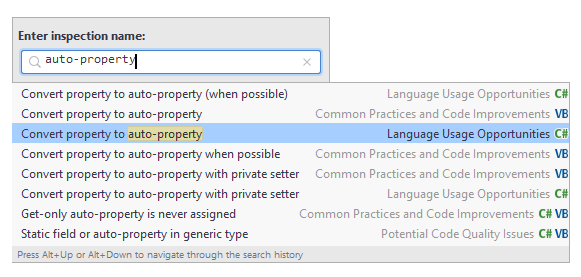
You can also inspect code in the desired scope with a single inspection of your choice — for example, you may want to check whether there are properties that could be converted to auto-properties.
To run a single inspection, press Ctrl+Alt+Shift+I or choose from the main menu, and then start typing the name of the inspection:
In the Solution Explorer, select items (files, folders, projects, solution folders) that you want to inspect, right-click the selection and choose Inspect Code... in the context menu.
In the dialog that opens, specify the scope where the code should be inspected.
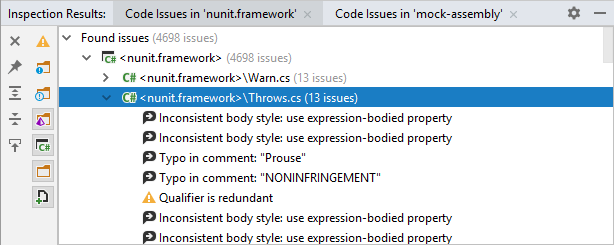
The Inspection Results window will open displaying detected code issues.
Analyze inspection results
In the Inspection Results window, you can view the list of discovered code issues and locate them in the editor by double-clicking the entries:

Each new run of code inspection opens a new tab in the window so the results of previous runs are preserved until you close their tabs.
Optionally, you can toggle Navigate with Single Click ![]() so that issues are located in the editor as soon as they get focus in the tool window.
so that issues are located in the editor as soon as they get focus in the tool window.