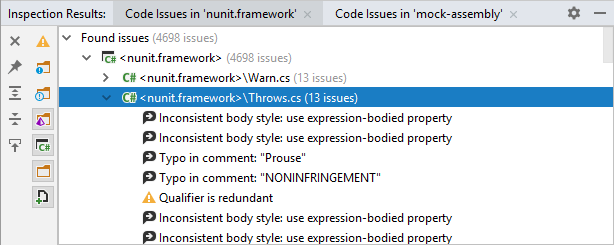
Inspection Results window
Ctrl+Alt+4
This tool window displays code issues when you run code inspection in specific scope.
All code issues displayed in this window have icons that indicate their severity level:
 - Error
 - Warning
 - Suggestion
 - Hint

Toolbar Controls
| Control | Name | Description |
|---|---|---|
| Pin Tab | Click this button to pin or unpin the current tab. You may need to pin a tab to prevent it from closing automatically when the maximum number of tabs is reached in this window. | |
| Expand All/ Collapse All Ctrl+NumPad +/ Ctrl+NumPad - | Expands/collapses all nodes in the current tab. | |
| | Navigate with Single Click | When this button is pressed, JetBrains Rider will locate the items you select in the window in their source views: projects and folders — in the Solution Explorer; files — in the editor. |
Title bar context menu and buttons
You can right-click the window title bar and use the context menu to configure its viewing mode, associate the window with a different tool window bar, or resize and hide the window.
You can also use the toolbar buttons:
| Item | Shortcut | Description |
|---|---|---|
Automatically sets the focus on the object name in the Project view when the editor area is in focus. | ||
| Shift+Escape | Hide the tool window. To hide all the tool windows, press Ctrl+Shift+F12. |
Last modified: 08 March 2021