Start, Pause, Resume, and Stop
To debug a process — your application, a unit test, a static method, or anything that has an executable configuration, you need to have this process running with the attached debugger.
Start debugging session
There are several options for starting a debugging session:
Start a run/debug configuration with the attached debugger (in the debug mode).
If the application is already running, attach the debugger to it. This way of debugging is convenient if you develop the application in JetBrains Rider, but (for some reasons) are not able to launch it directly from your IDE.
In Windows, you can set JetBrains Rider as the default just-in-time (JIT) debugger and start it each time a process calls for the JIT debugger.
To start a run configuration in debug mode
To use the currently selected configuration, do one of the following:
Press Shift+F9.
Click
 on the toolbar.
Choose from the main menu.
To choose a configuration, press Alt+Shift+F9 or select from the main menu, pick the desired configuration, and then press Enter.
If the currently selected configuration is .NET Project, .NET Static Method, .NET Executable, or .NET Launch Settings Profile, you can start debugging and then suspend the program in one go using the following actions:
Start Debugging and Step Over F8 or Start Debugging and Step Into F7 — starts the debugging and then breaks the execution at the entry point of the selected run configuration.
Start Debugging and Run to Cursor Alt+F9 — starts the debugging and then breaks the execution at the line where your caret is. If the execution encounters a breakpoint before the current line, it will break at the breakpoint.
Start Debugging and Run to Cursor Non-Stop Ctrl+Alt+F9 — starts the debugging and then breaks the execution at the line where your caret is. If there are breakpoints on the execution path, they will be ignored.
You can also invoke these actions on the toolbar of the Debug window or from the main menu, under .
Attach to a local process and debug it
Launch the process intended for debugging. You can do it from your operating system or using the JetBrains Rider terminal.
To find the process to attach to, do one of the following:
If JetBrains Rider is already running, press Ctrl+Alt+F5 or choose from the main menu.
Start JetBrains Rider and click Attach to Process on the welcome screen.
From the list of available processes that appears, select the desired process. Simplify your search by typing the first letters of its name or PID.
Rider remembers processes that you attached to previously, and displays them at the top of the list.The debugger will attach to the application.
Use JetBrains Rider as the default JIT debugger
Press Ctrl+Alt+S or alternatively select from the main menu, then choose on the left.
Click Set rider as default debugger.
When JetBrains Rider is set as the default JIT debugger and a process calls
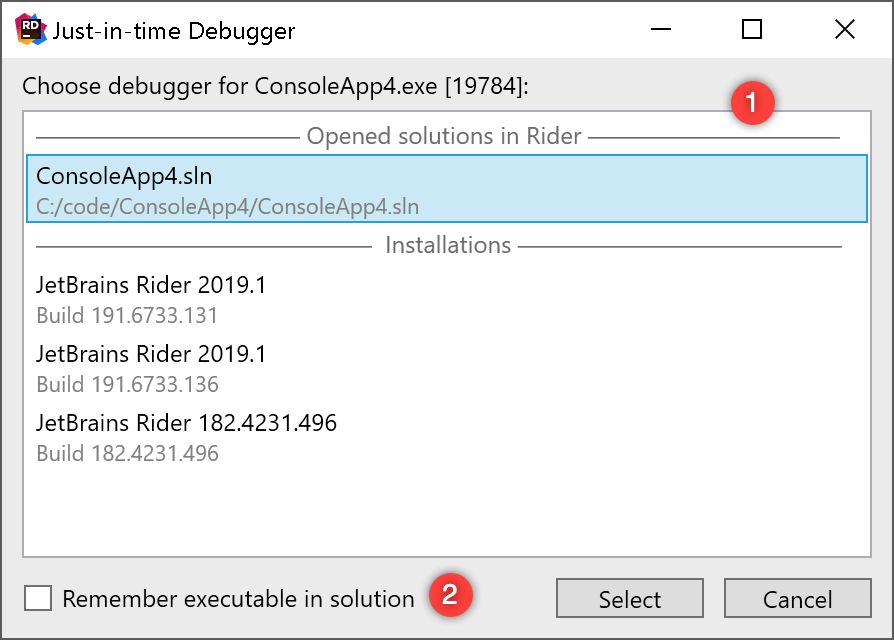
Debugger.Launch, you will see a dialog that helps you choose how to start the debugger. (1) If the solution with the application source code is open, you can pick it from the list of opened solutions.
Alternatively, you can choose a JetBrains Rider installation. In this case, debugger will start in an empty solution, and you will be able to debug decompiled code of the process. An additional checkbox allows you to remember the selected option (2), in which case for every future attempt, the debugger will be attached automatically:
Pause (suspend or break) execution
The main difference of simply running a program and debugging it, is that the debugger can freeze the execution (it is also called 'pause', 'suspend', or 'break') so that you can examine the program in this frozen state.
When the code is running in the debug mode, there are two ways to suspend it:
Set breakpoints in the code that you want to examine and wait until one of them is hit.
Break program execution with Ctrl+Alt+Break. The debugger will finish the statement that is executing at the moment you pause, and then stop at the statement that should be executed next.
In the suspended state, the current execution point — the next statement to be executed — is marked with a yellow execution pointer ![]() in the left-hand gutter of the editor. To quickly find the current execution point, press Alt+F10 or click Show Execution Point
in the left-hand gutter of the editor. To quickly find the current execution point, press Alt+F10 or click Show Execution Point ![]() in the Debug window.
in the Debug window.
Resume execution
To resume the execution of a suspended process, press F9 or click Resume Program in the Debug window.
The process will continue running until it hits a breakpoint, until it exits, until you stop the execution or detach the debugger.
Stop execution
To finish the debugging session, press Ctrl+F2, select in the menu, or click Stop ![]() in the Debug window.
in the Debug window.
This will detach the debugger from the application and make the application exit (in case you have run it from JetBrains Rider).
Edit and continue
You can also edit the code of a suspended program and then continue debugging without restarting. The project will recompile in the background. This works in projects targeting .NET Framework and .NET Core on Windows (except WPF) when Enable Edit And Continue is selected on the page of JetBrains Rider settings Ctrl+Alt+S.
There are cases when modifying the code is not possible and a restart is required. These include changing signatures, modifying generic functions, renamings of any kind, and some more. If this happens JetBrains Rider will make you aware by showing a tooltip.
After you make necessary changes in your code, click Apply changes on the editor banner that appears. JetBrains Rider will recompile the code and the changes will be available after you resume execution.
