Work with Coverage Results
No matter what type of coverage analysis you perform, coverage of unit tests, or coverage of an application, dotCover saves coverage results in a coverage snapshot. You can then further investigate these results using the editor and the Unit Tests Coverage window.
Visualize code coverage in the editor
After you finish a coverage session, Rider will open the Unit Tests Coverage window.
Click Highlight code
 on the toolbar of the window.
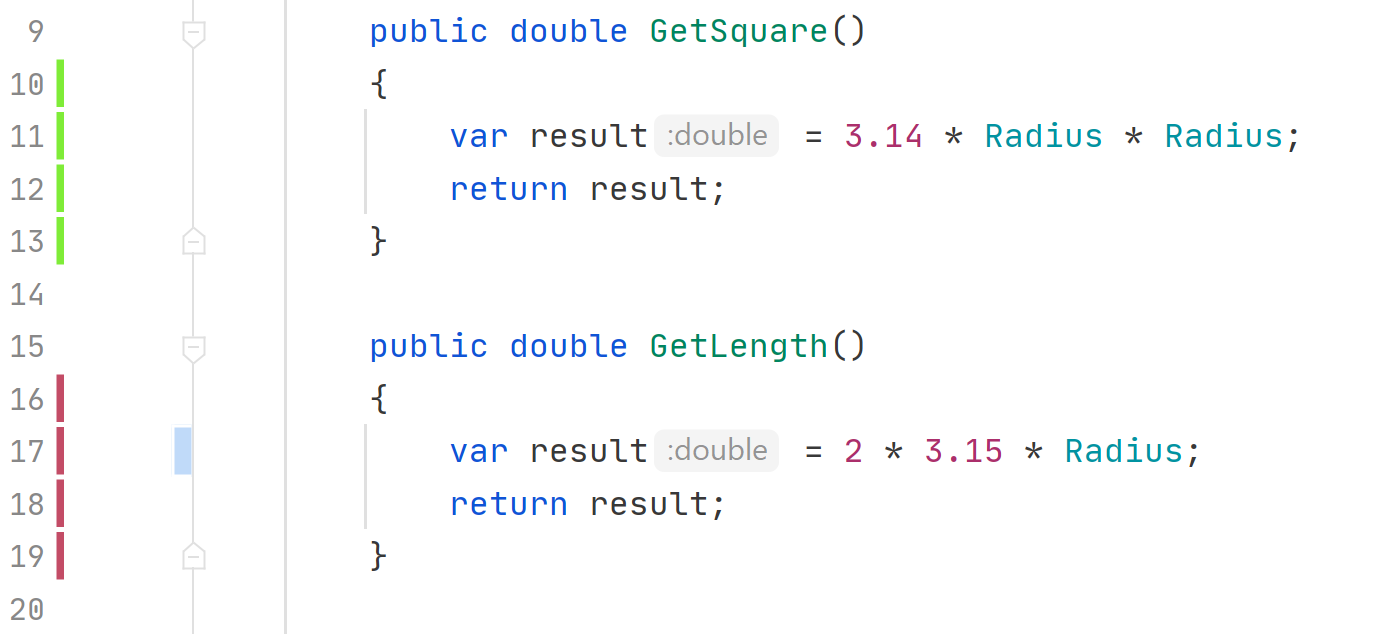
dotCover will highlight code in all assemblies that are included into the current coverage snapshot (see the gutter):

To indicate the state of the code statement, dotCover uses colored markers in the gutter:
| Marker | Description |
|---|---|
| At least one statement in a line is not covered by unit tests. | |
| All statements in a line are covered by unit tests. All tests pass. | |
| All statements in a line are covered by unit tests. At least one test fails. |
Right after you change the code, test results become outdated. In this case, a marker keeps its color but it becomes paler. The marker's tooltip shows the info about previous state as well:

Navigate to covering tests
In the editor, place the caret at a code statement.
Make sure the highlighting is enabled and hold the cursor on a particular highlighting marker until a tooltip appears. Then click the tooltip.
In the popup that appears, you will see the list of unit tests that cover the statement.

Double-click the desired unit test to open it in the editor.
Navigate from a code symbol to the coverage tree
When working in the editor, you can quickly locate code symbols (types, methods, and so on) in the code coverage tree. This may be helpful if you want to see how well a code symbol is covered in the current snapshot.
In the editor, place the caret at a code symbol that you want to locate in the coverage tree.
In the Unit Tests Coverage window, click Navigate from Editor
 .
.The symbol will be located in the current tree.
Search the coverage tree
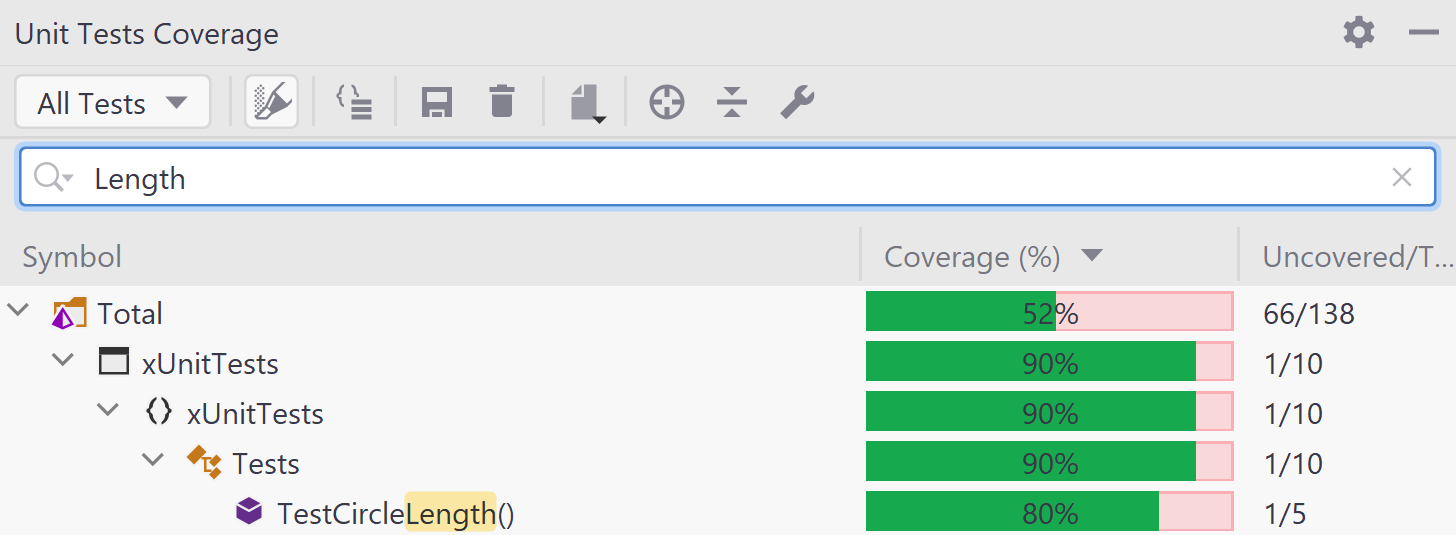
The coverage tree displayed in the Unit Tests Coverage window provides a quick-search option for all items included in the tree.
Open the Unit Tests Coverage window.
In the search field, start typing your search string.
Start typing a search string.
The Search box will appear under the toolbar displaying your search string and the coverage tree will be filtered according to the search string.

Note that applying search filters does not recalculate total coverage.
Export coverage results
dotCover helps process coverage data the way you need. Exporting to several formats, including HTML, XML, JSON, and XML for NDepend enables you to share coverage reports with the rest of the team or pass coverage information to external services.
In the Unit Tests Coverage window, click Export coverage report
 .
.In the list that opens, choose a format for export.
In the dialog that appears, specify a filename and location to which the report should be saved.