Call tracking
Call Tracking enables you to view and navigate through call chains in your code. JetBrains Rider Call Tracking lets you explore functions, events, interfaces, and closures.
In the hierarchy view, JetBrains Rider uses icons to distinguish between different kinds of symbols. You can learn meanings of the icons on the Symbol icons schemes reference page.
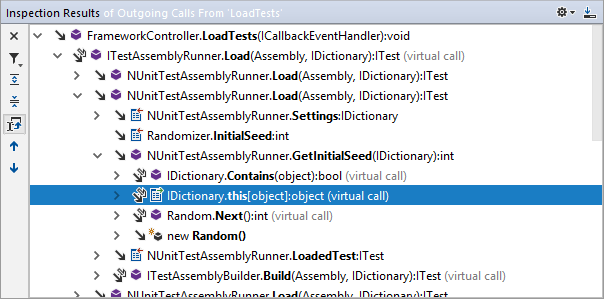
Investigate outgoing calls
Place the caret at the name of a method, event, property or constructor.
Press Ctrl+Alt+Shift+A and choose Outgoing Calls in the Inspect This list.
In the Inspection Results window that opens, you can expand the member node to run code analysis on it and to display all members called by the current member. You can also expand each of the child nodes.

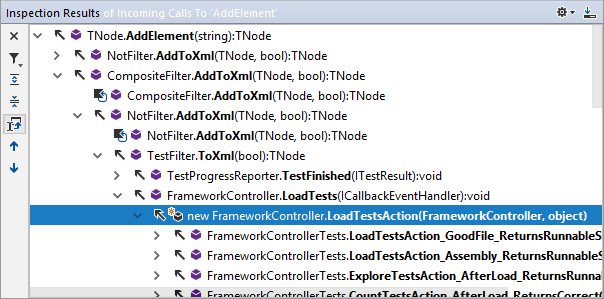
Investigate incoming calls
Place the caret at the name of a method, event, property or constructor.
Press Ctrl+Alt+Shift+A and choose Incoming Calls in the Inspect This list.
In the Inspection Results window that opens, you can expand the member node to run code analysis and to display all members that call the current member. You can also expand each of the child nodes.
