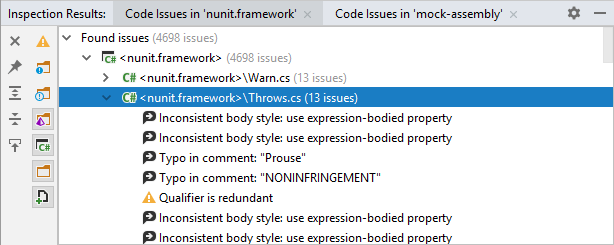
Inspection Results window
This tool window becomes available after you run code inspection in specific scope.
The code issues found at each code inspection run are displayed in a separate tab where you can group them either by the project structure or by the category and type of the inspection.
All code issues displayed in this window have icons that indicate their severity level:
 - Error
 - Warning
 - Suggestion
 - Hint

Toolbar Controls
Control | Name | Description |
|---|---|---|
Pin Tab | Click this button to pin or unpin the current tab. You may need to pin a tab to prevent it from closing automatically when the maximum number of tabs is reached in this window. | |
| Expand All/ Collapse All Ctrl+NumPad +/ Ctrl+NumPad - | Expands/collapses all nodes in the current tab. |
| Navigate with Single Click | When this button is pressed, JetBrains Rider will locate the items you select in the window in their source views: projects and folders — in the Solution Explorer; files — in the editor. |
Title bar context menu and buttons
You can right-click the window title bar and use the context menu to configure its viewing mode, associate the window with a different tool window bar, or resize and hide the window.
You can also use the toolbar buttons:
Item | Shortcut | Description |
|---|---|---|
Automatically sets the focus on the object name in the Project view when the editor area is in focus. | ||
Shift+Escape | Hide the tool window. To hide all the tool windows, press Ctrl+Shift+F12. |