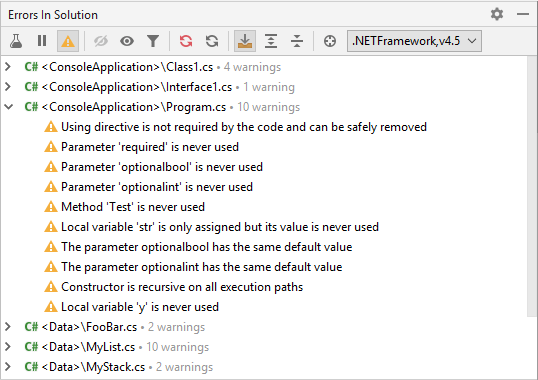
Errors/Warnings in Solution window
This window displays the list of solution-wide errors/warnings that were discovered during solution-wide analysis.

Toolbar Controls
Control | Name | Description |
|---|---|---|
| Analyze Errors in Solution | Toggles solution-wide analysis on/off. |
| Pause/Continue Analysis | If you turn solution-wide analysis off and then decide to turn it on again, JetBrains Rider will have to repeat some of the initial calculations, which may be time-consuming. To avoid this, you can pause and resume solution-wide analysis instead. |
| Hide/Show Warnings | If warnings monitoring is disabled on the page of JetBrains Rider settings, this button will start the analysis of warnings and if any warnings are found, they will be shown in the window. If warnings monitoring is enabled in settings, this button lets you show or hide warnings without restarting the analysis. When warnings are enabled in solution-wide analysis, it works as follows: as long as there are errors in the solution, only errors will be displayed; unresolved warnings will only appear when the last error is fixed. When warnings are disabled, the status bar indicator will turn green as soon as the last error is fixed. |
| Ignore Errors | Excludes selected errors/warnings (or all errors/warnings in a selected file) from the list of found issues (or strikes them through if Show Ignored Errors is switched on). For more information, see ignoring errors in solution. |
| Stop Ignoring Errors | Shows or previously ignored errors (or removes strikethrough if Show Ignored Errors is switched on). For more information, see ignoring errors in solution. |
| Show Ignored Errors | Makes ignored errors visible but strikes them through. |
| Reanalyze Files with Errors | Launches the process of reanalyzing files where errors were previously found. |
| Reanalyze All | Launches the process of reanalyzing all files in the solution. |
| Expand All/ Collapse All Ctrl+NumPad +/ Ctrl+NumPad - | Expands/collapses all nodes in the current tab. |
| Show Frameworks in Tree | When this option is enabled, you can expand each error/warning to see for which of the selected .NET frameworks it applies. |
Frameworks selector | Use this selector to choose which .NET frameworks should be used as sources of errors and warnings. | |
| Navigate with Single Click | When this button is pressed, the editor opens the file and scrolls it according to the items selected in the window. |
Title bar context menu and buttons
You can right-click the window title bar and use the context menu to configure its viewing mode, associate the window with a different tool window bar, or resize and hide the window.
You can also use the toolbar buttons:
Item | Shortcut | Description |
|---|---|---|
Automatically sets the focus on the object name in the Project view when the editor area is in focus. | ||
Shift+Escape | Hide the tool window. To hide all the tool windows, press Ctrl+Shift+F12. |