Debug exceptions
tip
When copying an exception stack trace (for example from an ASP.NET application) to the clipboard, JetBrains Rider allows navigating from that stack trace to the exception location.
Exception is an error that occurs in runtime and typically breaks normal execution flow. JetBrains Rider allows you to effectively debug application exceptions: you can explicitly tell the debugger to suspend the program execution when any unhandled exception or an exception of a particular type is thrown. JetBrains Rider stops the execution right after the exception occurs (before any exception handling is run) allowing you to examine program's stack frames.
Debug user-unhandled exceptions
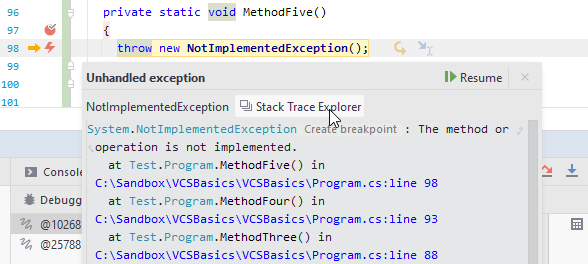
JetBrains Rider can break program execution when an unhandled exception is thrown and display the exception popup with the call stack. You can click Resume F5 to continue running the program, or you can click Stack Trace Explorer to open the exception details in the Stacktrace window where you can explore the stack trace right away or later.

To configure at which kinds of exceptions the debugger should break, use the following options on the Build, Execution, Deployment | Debugger page of the IDE settings Ctrl+Alt+S:
- Break on user-unhandled exceptions (excluding Mono)
Use this option to make the debugger stop on exceptions that meet all the following criteria:
not handled within the code of the current solution
handled in external code
thrown either in the code of the current solution or in external code, but always have code of the current solution in the call stack
- Process exceptions outside of my code (excluding Mono)
Use this option to make the debugger stop on exceptions that meet all the following criteria:
thrown in external code
handled in external code
have no code of the current solution in the call stack
If you do not need to stop in external code, it is recommended to keep this checkbox disabled because it can affect debugger performance, especially if external code throws lots of exceptions. This might be even more noticeable on macOS and Linux, where the .NET Core debug engine is relatively slow.
- Break on unhandled exceptions
Use this option to break on exceptions that are handled neither in user code nor in library code. It is recommended to keep this option enabled because such exception will stop the application process anyway.
Exception breakpoints
To debug an exception of a particular type , you should create a special exception breakpoint. Unlike line breakpoints, exception breakpoints are assigned not to a certain line of code, but to a certain exception type (for example, in case of C#, it can be any type inherited from the Exception type).
Add an exception breakpoint
Do one of the following:
Choose Run | Stop On Exception from the main menu.
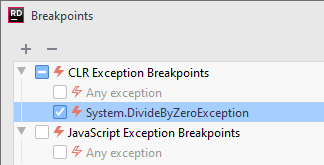
In the Breakpoints dialog (Ctrl+Alt+B or Run | View Breakpoints…) , click
 and select CLR Exception Breakpoints in case of C# or Visual Basic .NET, or JavaScript Exception Breakpoints in case you debug a script written in JavaScript.
In the dialog that opens, enter the desired exception type name and click OK. The breakpoint is added to the list of breakpoints under CLR Exception Breakpoints or JavaScript Exception Breakpoints in the Breakpoints dialog.

Specify breakpoint properties. Note that if Only in my code is enabled, the debugger will suspend the program only if the exception is thrown by the user code.