Tips and tricks
Export your code to HTML
You can use JetBrains Rider for pretty-printing code in any of the supported languages to syntax-colored HTML. This may come in handy if you need to display your code on the web, or if you consider an environment-friendly alternative to printing your code on paper.
All you need to do is to open the desired code file in the editor and choose File | Export | Export Files or Selection to HTML… in the main menu (if you want to export only a part of your code file, make a selection before invoking this command). In the dialog that opens, you will be able to choose additional options, such as exporting all files in the solution directory or including line numbers to the output.
The resulted HTML will display the code in exactly the same way as you see it in the editor, retaining syntax highlighting and formatting.
Use Productivity Guide
JetBrains Rider analyzes features you use during your development sessions and reminds you of the features you might have missed.
Choose Help | Productivity Guide from the main menu to display the list of features with usage statistics and tips.
Besides analysing your personal usage of features, you can discover similar features that you have never used. One of the ways to do so is to sort features by Group, and look for unused features that are next to the frequently used ones. You can quickly check how to use the feature by selecting it and studying the corresponding tip that opens.
Create a desktop shortcut on Linux
When you install JetBrains Rider on Linux, you can opt out creating a desktop shortcut for it. If you did so and want to add the desktop shortcut later, you may find it quite tricky with the standard operating system tools. To simplify this procedure, you can use the Create Desktop Entry command, which is available on the Welcome screen (Configure | Create Desktop Entry) or in the main menu (Tools | Create Desktop Entry).
You can choose to create the shortcut:
For all of your computer users. In this case, the application entry file is created in
/usr/share/applications, oronly for yourself. The application entry file is then created in
~/.gnome/appsand~/.local/share/applications.
View documentation of .NET classes and methods
When your caret is on a usage of a .NET symbol, you can press F1 to open the related Microsoft documentation page in your browser. Alternatively, you can press Ctrl+K, I to view a brief description of the symbol in the editor popup.
Monitor the IDE performance
warning
Activity Monitor is an experimental feature in JetBrains Rider.
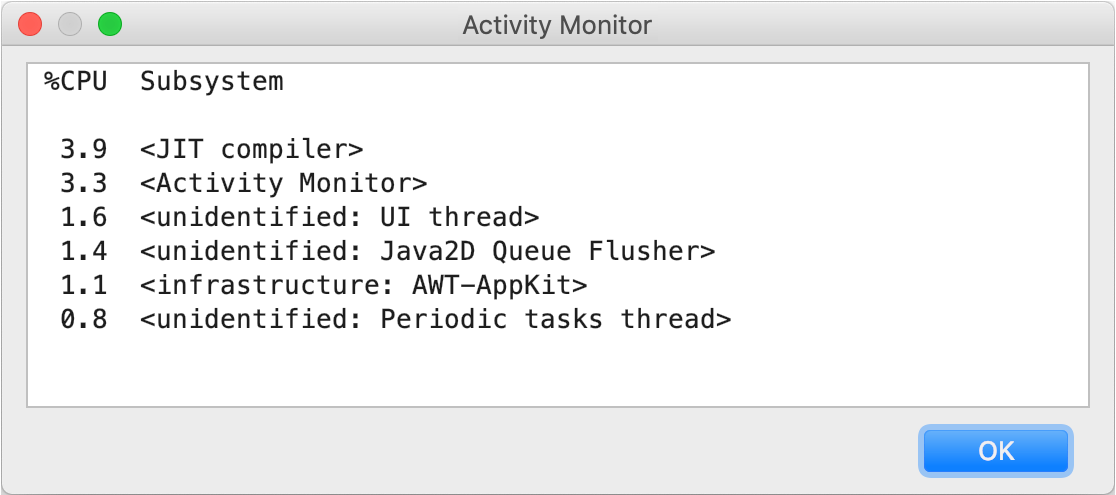
In case of performance issues, you can use the Activity Monitor to see the percentage of time that the CPU is busy processing operations from various subsystems and plugins.
From the main menu, select Help | Diagnostic Tools | Activity Monitor. It lists all subsystems and plugins that are using the CPU at the moment, and arranges them by how much %CPU they are using.
