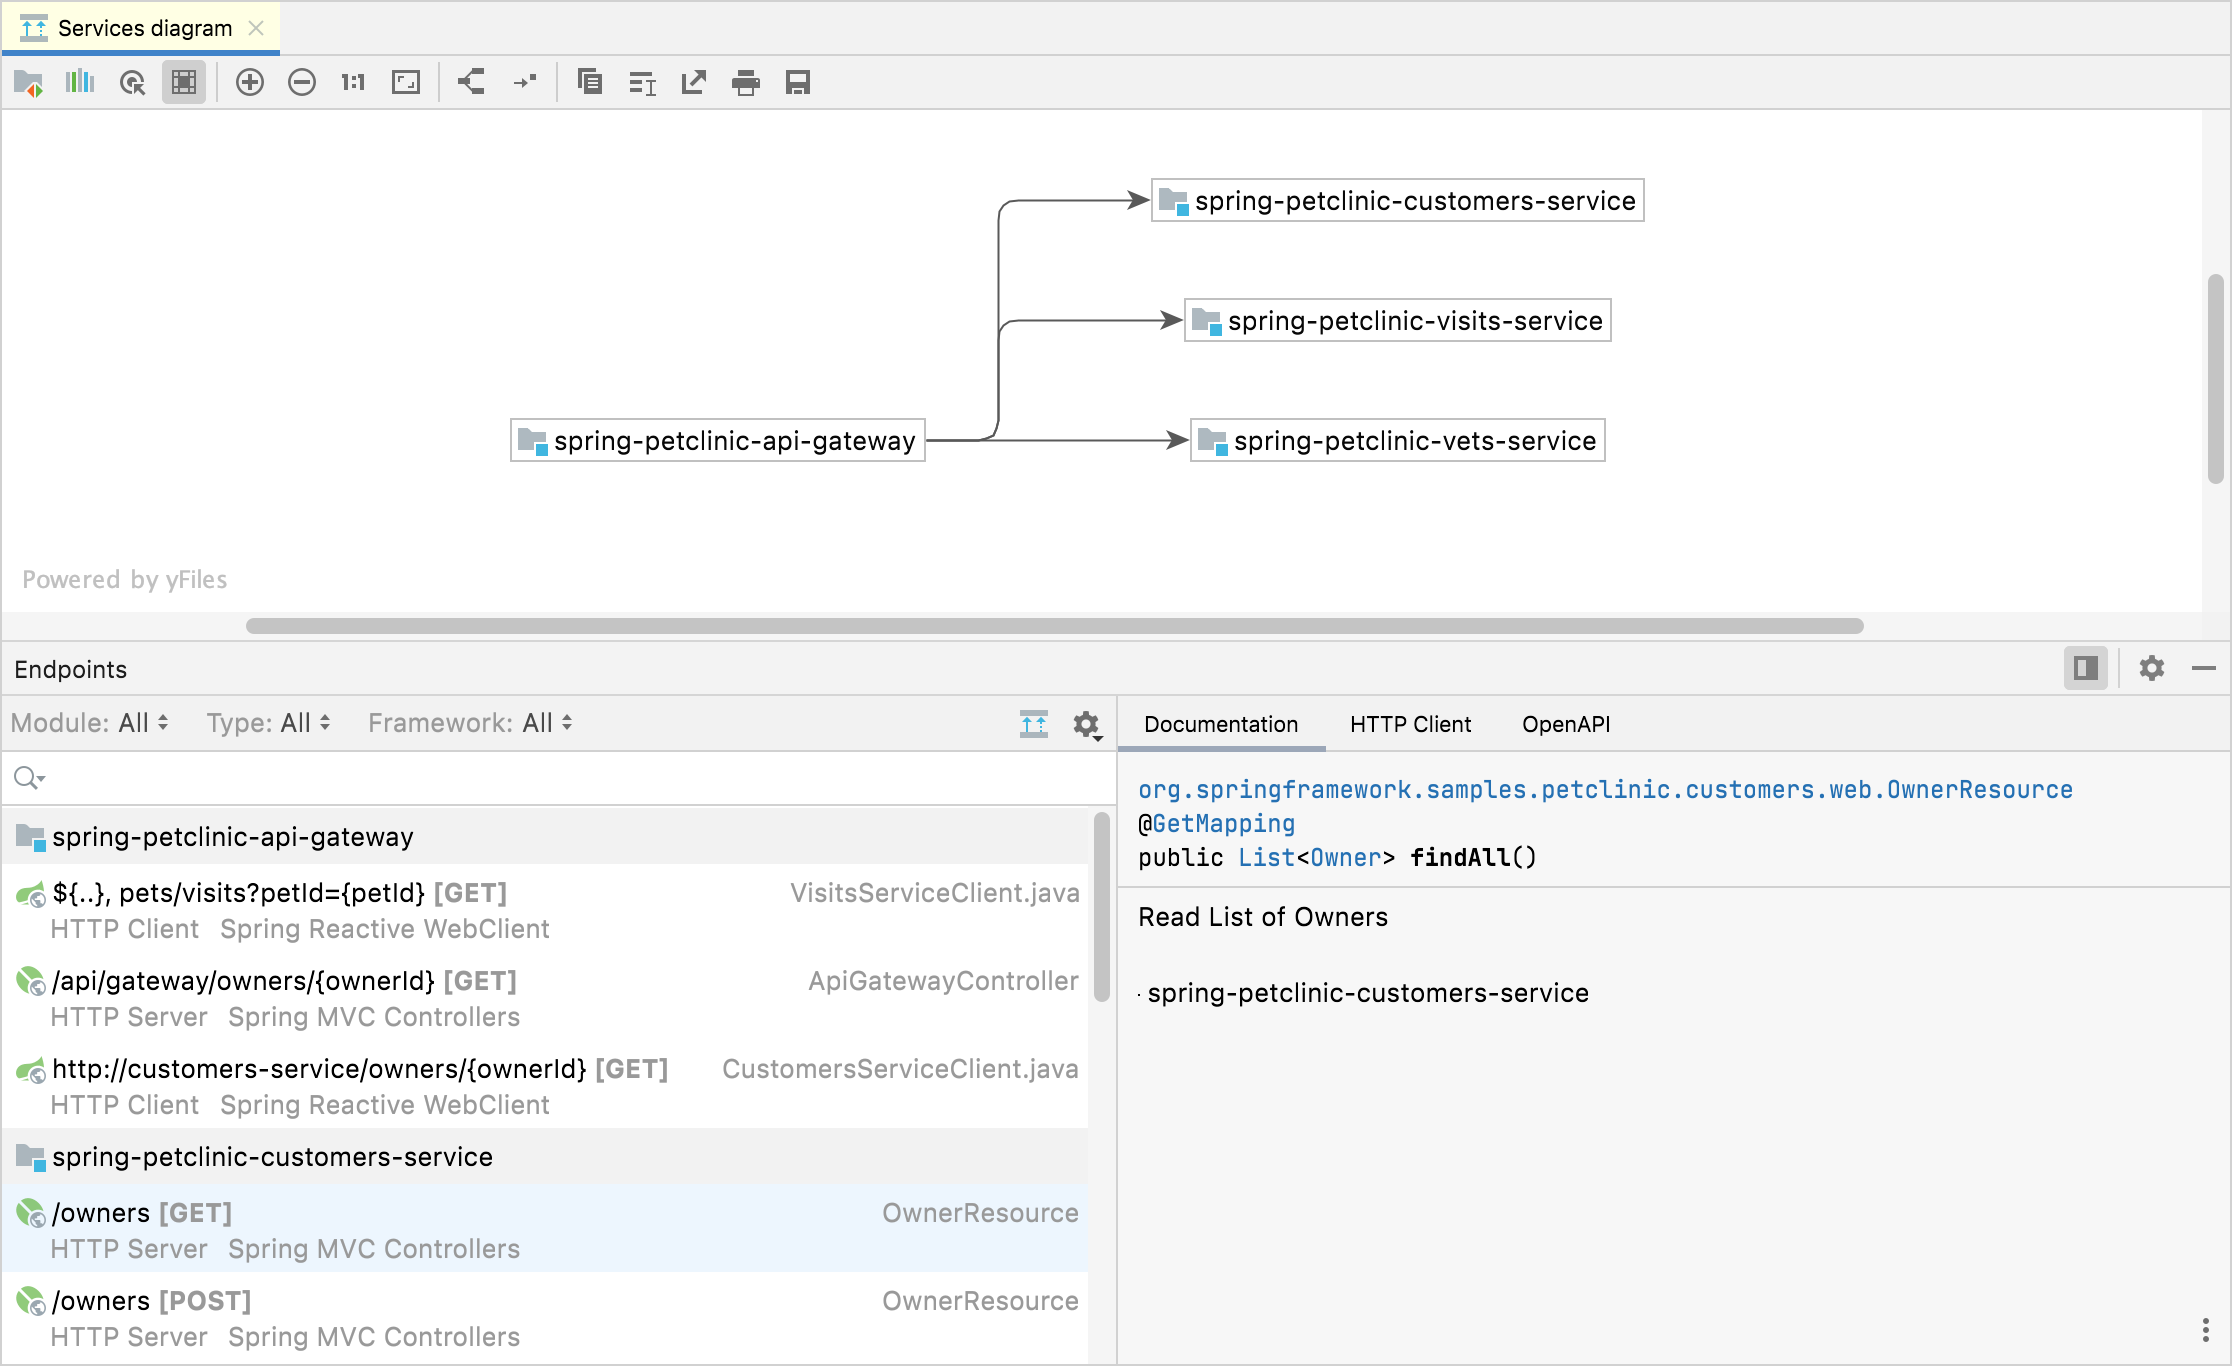
Endpoints tool window
Last modified: 10 May 2023View | Tool Windows | Endpoints
The Endpoints tool window provides an aggregated view of both client and server APIs used in your project for HTTP and WebSocket protocols. The tool window can assist you when developing microservices and backend-frontend communication. It is also helpful for exploring third-party APIs.
You can also navigate from the Endpoints tool window or from endpoint usages to the relevant endpoint declaration using the Go to Declaration action F12 or Ctrl+Click.
In the Endpoints tool window, you can filter the list of endpoints by module, type, and framework. To list endpoints from external sources (for example, from remote OpenAPI specifications), select External under Module.

Endpoints marked as deprecated appear with a strikethrough (crossed out).
Toolbar
Item | Description |
|---|---|
Module | Filter endpoints by module or select an external module |
Type | Filter endpoints by type |
Framework | Filter endpoints by framework |
Configure OpenAPI Sources: Add an external OpenAPI specification (for example, from SwaggerHub) to include endpoints from this specification in the Endpoints tool window and highlight them with a yellow background. In the OpenAPI Specifications window that opens, click For more information, see Add a remote OpenAPI specification. | |
Configure the tool window layout and filters:
|
Endpoint details
When you select an endpoint, you can see the details in the right pane separated into tabs. Use to show and hide the details pane.
Shows the documentation for the selected endpoint. Double-click an endpoint to navigate to its source code.

Shows the generated HTTP or gRPC requests for the selected endpoints.
If the corresponding server is running, you can submit the request to see the response immediately or open it in a separate HTTP requests file in the editor. For more information, see HTTP Client.

note
The tab is available if the OpenAPI Specifications plugin is installed and enabled.
For gRPC requests, the tab is not enabled because gRPC APIs are defined through .proto files.
Shows the generated OpenAPI specification for the selected endpoints.

To preview the specification in a separate file, click .
Services diagram
JetBrains Rider provides a diagram to show the interactions between microservices. In the Endpoints tool window, click .
