Analyze memory allocation
Use the Memory Allocation view to analyze allocations on a specific time interval: find out what objects were allocated on this interval and what functions allocated these objects. The view can show you allocation data even when profiling is still in progress: memory snapshots are not required.
dotMemory can collect memory allocation data in one of two modes:
- Sampled
(Default, Windows only) dotMemory collects limited allocation data: For each function that allocates objects you can view only approximate object sizes. The information about object count is not available.
The pros of the Sampled mode:
It doesn't slow down the profiled application.
You can use it when the profiler is attached to an already running application.
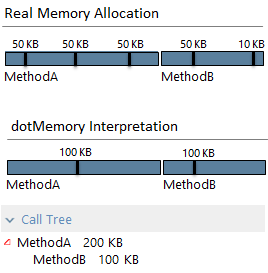
The data is not detailed because it is based on ETW events: the allocation event is triggered each time the size of the allocated memory exceeds 100KB in total. For example, a thread allocates five 50 KB memory blocks during profiling. In such a case, dotMemory will detect only two allocations of 100 KB.
You can switch between these modes anytime during the profiling session. Note that if you want to analyze full allocation data, the Full data collection mode must be enabled during the desired time range. If this range contains intervals with Sampled data, the Memory Allocation view will show you only sampled allocation data.
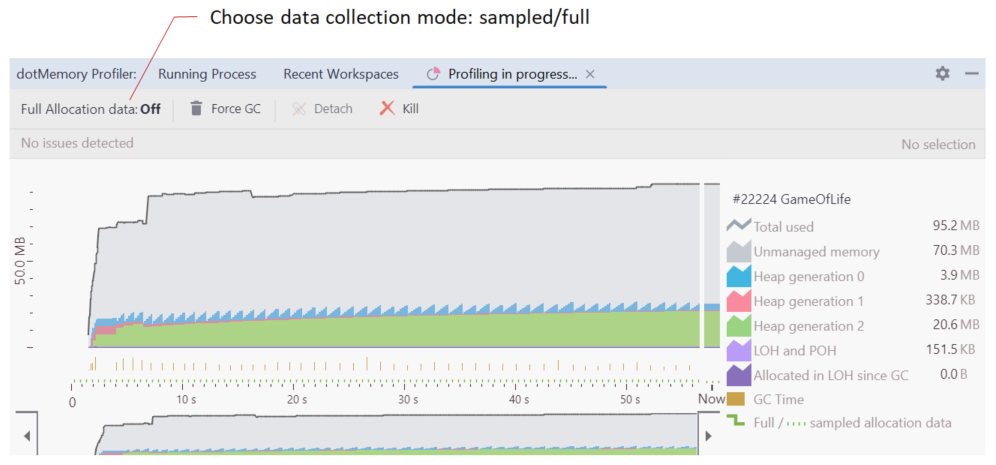
Depending on how detailed data you want to get, use either Sampled or Full data collection mode.
On the timeline graph, select a desired time interval.
Click the Allocated: ... MB link or the
 button to open the Memory Allocation view.
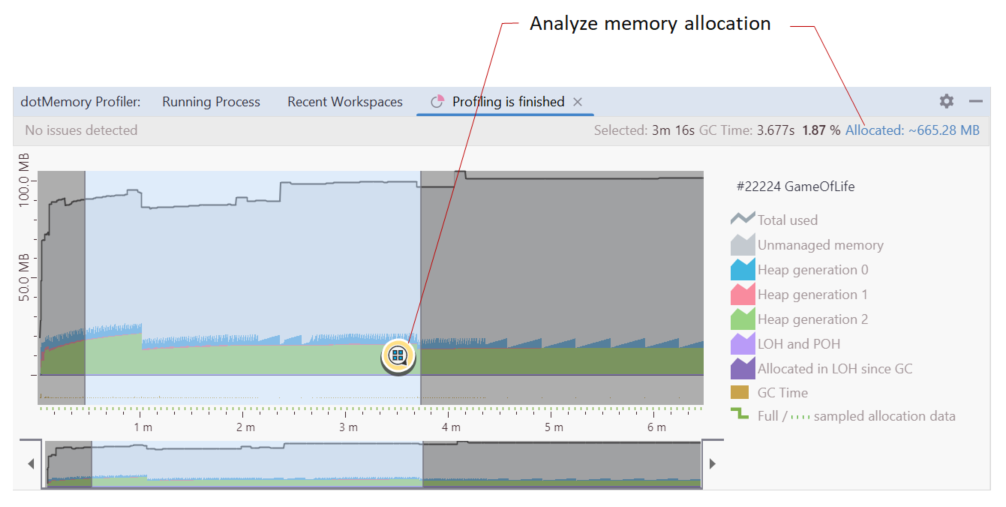
This will open a new editor document with allocation data on the selected interval.
In the document, choose how you want to analyze the data: using grouping by Types, by Methods, by Call Tree, or by Subsystems.
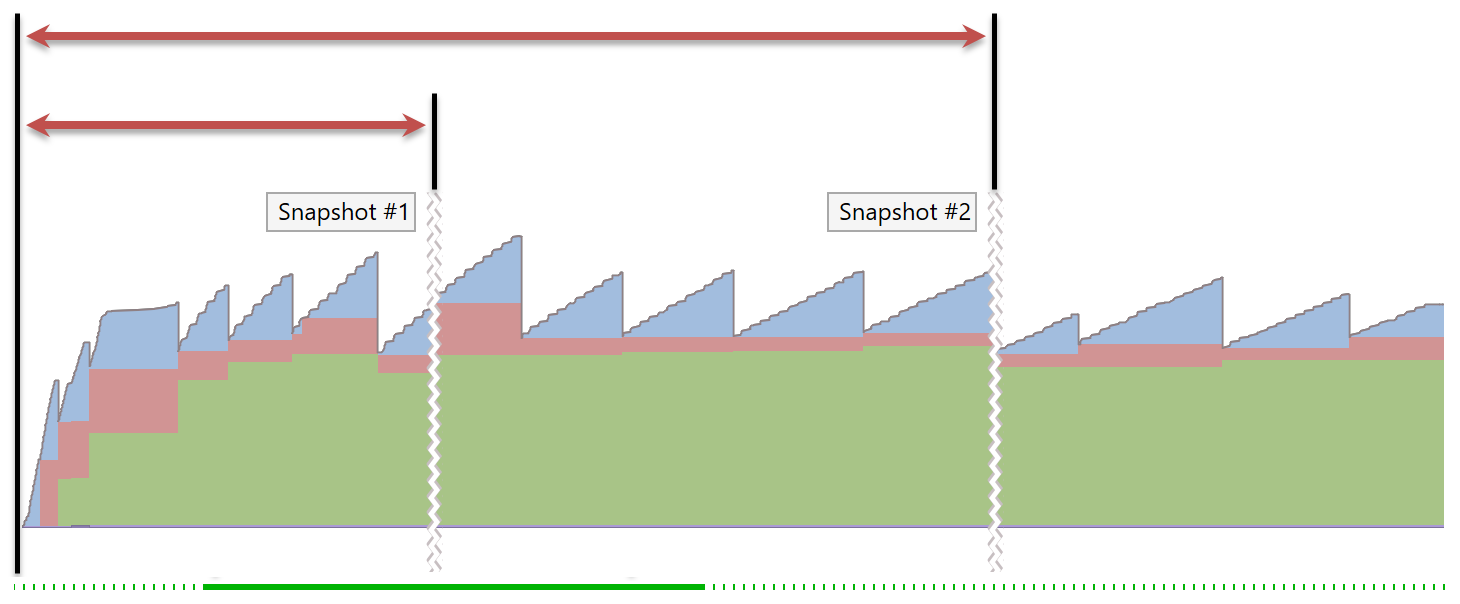
Under Memory Snapshots, find the required snapshot and click Memory allocation.
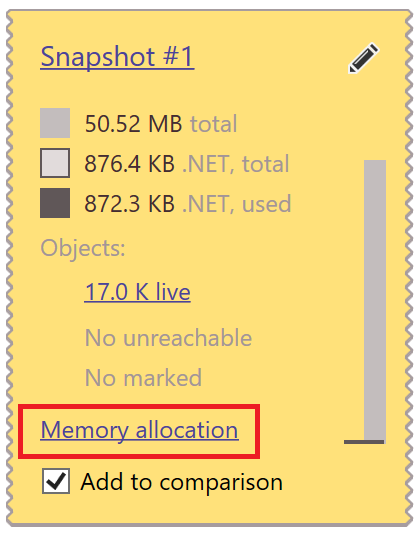
Choose how you want to analyze the data: using grouping by Types, by Methods, Call Tree, or by Subsystems.
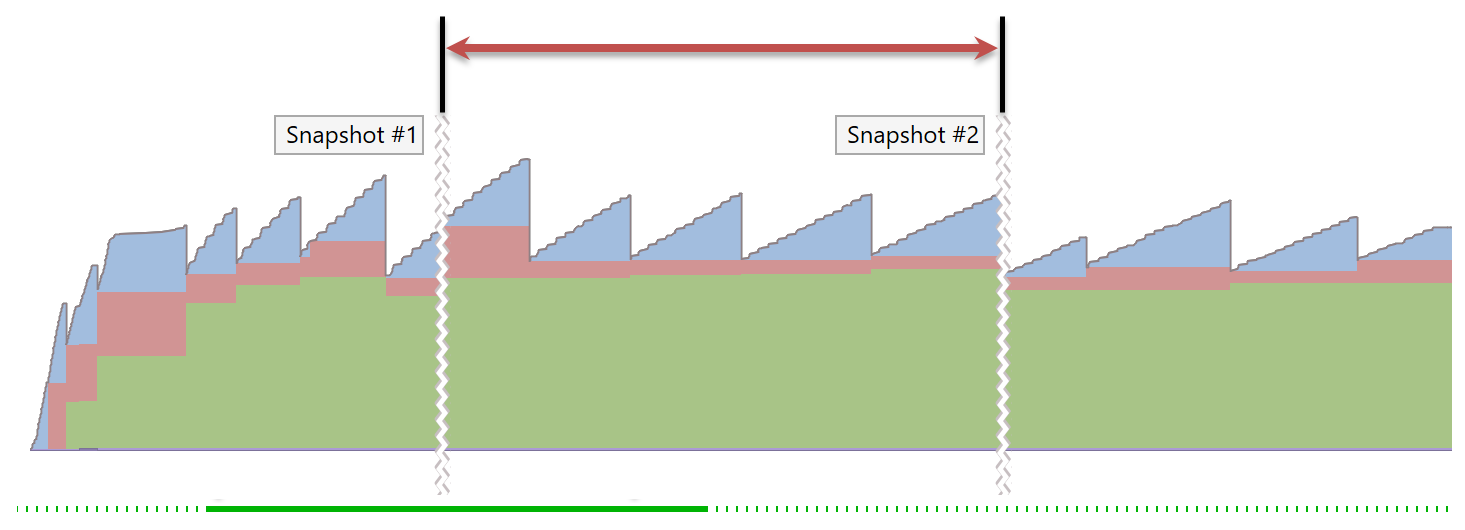
Under Memory Snapshots, find the required snapshots and add them to the Snapshot Comparison area by clicking Add to comparison for each snapshot.
In Snapshot Comparison, click View memory allocation.

Choose how you want to analyze the data: using grouping by Types, by Methods, by Call Tree, or by Subsystems.
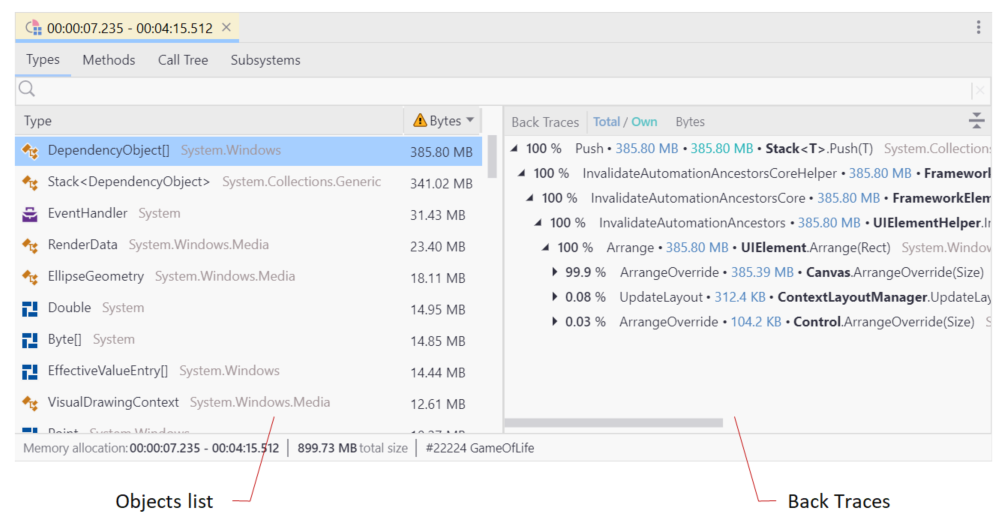
The Types view consists of two parts: the objects list and the Back Traces tree.
The list shows you the objects allocated on the selected time interval grouped by the object type. Select a particular type to see what functions allocated the objects of this type.
Name | Description |
|---|---|
Type | Type name. |
Objects | The number of objects of the same type. |
Bytes | The overall shallow size of the objects in bytes. |
The Back Traces tree shows you all call trees that allocated the objects currently selected in the objects list. The calls are shown from the bottom up: the last call in the call stack is a top node. In other words, Back Traces is the inverted call tree.
You can sort the tree by the amount of allocated memory (Total / Own Bytes) or by the number of allocated objects (Total / Own Objects). To switch the sorting, click the Total / Own ... column header.
The Total / Own ... column shows how much memory (objects) were allocated in a particular call tree (Total) or in a particular call (Own).
For example:

The set_Capacity method allocated 149.80 MB (Own). The method was called from two call stacks:
through the
AddWithResizemethod: 142.69 MBand through the
EnsureCapacitymethod: 7.11 MB
To view where in the Call Tree a particular method is called, right-click the method and choose Show occurrences of this method in 'Call Tree'. This will show the call tree containing all method calls merged.
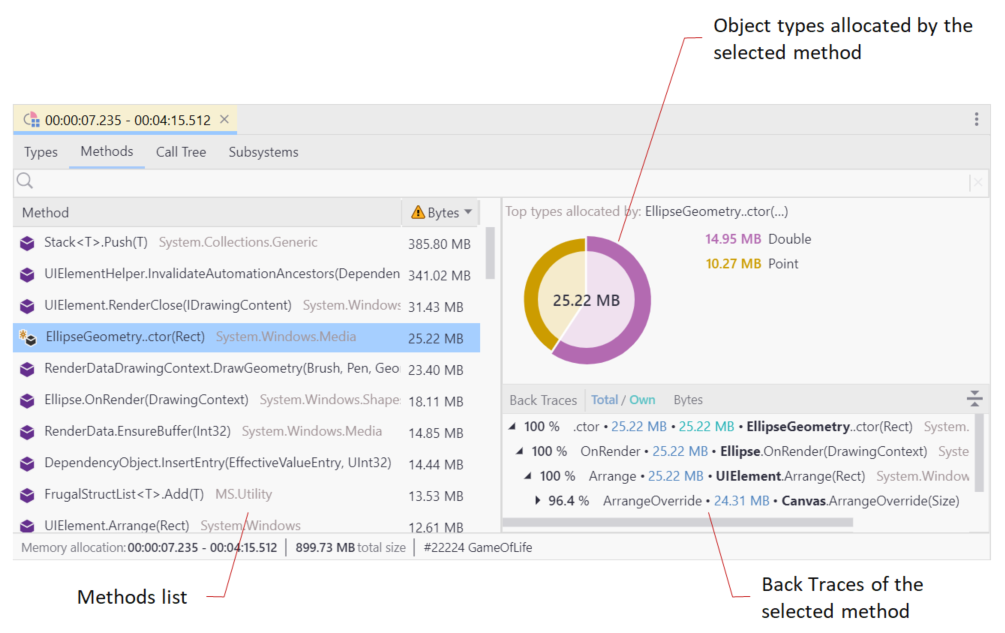
The Methods view consists of three parts: the methods list, the Back Traces tree, and the sunburst diagram of top five allocated object types.
The list shows you the methods that were called during the selected time interval. Select a particular method to see what object types were allocated by the method as well as method's back traces tree. Note that each method in the list is unique - it represents all calls of this method from all call stacks.
Name | Description |
|---|---|
Method | Method name. |
Objects | The number of objects allocated by method calls. |
Bytes | The overall shallow size of the objects in bytes. |
The Back Traces tree shows you all call stacks that called the method currently selected in the method list. The calls are shown from the bottom up: the last call in the call stack is a top node. In other words, Back Traces is the inverted call tree.
The Back Traces tree is similar to the one in the Types view.
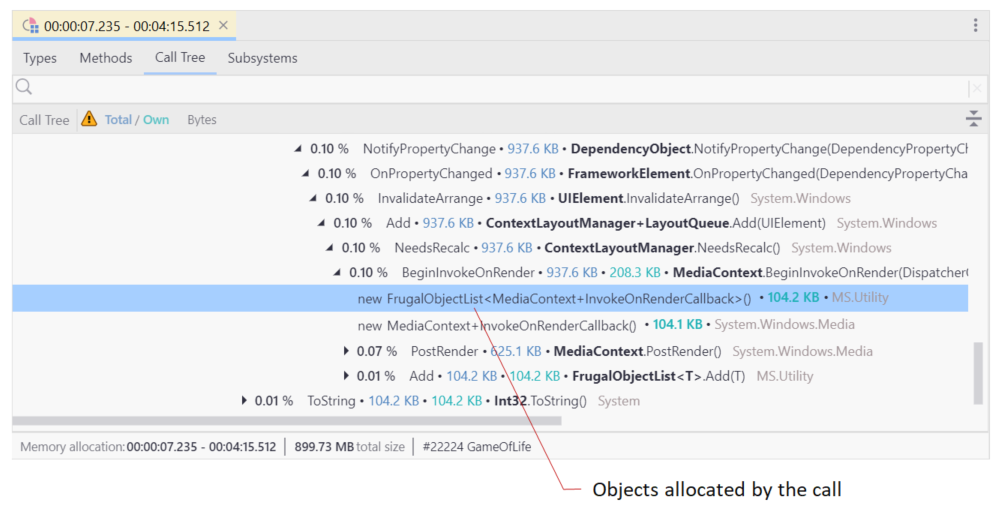
The Call Tree view shows the call tree for the selected time interval. If a call allocated objects, the object types will be shown in the tree below the call.
The Total / Own ... column shows how much memory (objects) were allocated in a particular call tree (Total) or in a particular call (Own).
You can sort the tree by the amount of allocated memory (Total / Own Bytes) or by the number of allocated objects (Total / Own Objects). To switch the sorting, click the Total / Own ... column header.
To filter the call tree, start typing in the ![]() search field on the top of the window. Learn more about how to set filters
search field on the top of the window. Learn more about how to set filters
To view a subsystem for a particular method, right-click the method and choose Show this method's subsystem.
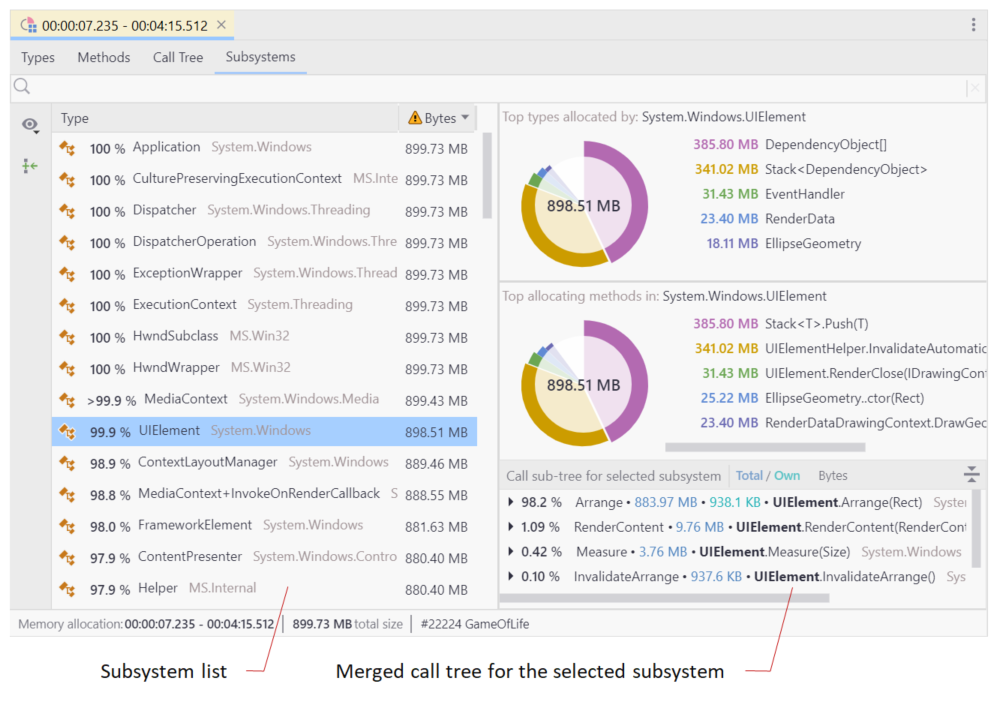
A subsystem groups all methods belonging to a particular type, namespace, or assembly. To switch the grouping type, use the Type, Namespace, and Assembly buttons at the top of the table. Use the Subsystems view to quickly understand how much memory does a particular application component allocate. For example, this view is especially helpful for evaluating memory allocation of your newly added or refactored code.
Each subsystem includes all objects created by its entire call subtree (Total size). For example, in a console application, the subsystem of the type Program will include all objects created by the application as Program.Main() is the top node in the app's call tree.
Subsystems is a master-detail view. Choose a subsystem in the table on the left and on the right you will see:
Top five types that were allocated by instances of the selected subsystem.
Top five methods of the selected subsystem that allocated most of the memory.
Merged call tree for the selected subsystem.
If a call allocated objects, the object types will be shown in the tree below the call.
The Total / Own ... column shows how much memory (objects) were allocated in a particular call tree (Total) or in a particular call (Own).
You can sort the tree by the amount of allocated memory (Total / Own Bytes) or by the number of allocated objects (Total / Own Objects). To switch the sorting, click the Total / Own ... column header.
To view the location of a particular method in the application call tree, right-click the method and choose Show this method in 'Call Tree'.
An application contains many subsystems of no interest for further analysis. For example, it's obvious that a subsystem for the System.Windows.Application type will include all calls made during the profiling session as the application is started by the Application.Run() method. In such cases, you can exclude the subsystems that you don't want to analyze.
Select a subsystem in the list.
Press Del or right-click the subsystem and choose Exclude from scope in the context menu.
dotMemory will gray out the excluded subsystem and put it to the end of the subsystems list.
Scroll to the end of the subsystems list.
Select the excluded subsystem.
Press Del or right-click the subsystem and choose Return back to scope in the context menu.
You can filter out items that are of no interest to your analysis.
Start typing the desired search pattern in the
.png) search field.
search field.dotMemory will exclude all items that don't match the pattern.
You can make your search more efficient by using the following tips:
Use CamelHumps. E.g.
fowill return objects of bothSystem.Drawing.FontandMS.Utility.FrugalObjectListtypes.Use special symbols, like wildcards and others. The full list is shown in the table below.
Symbol | Description | Example |
|---|---|---|
| Wildcard |
All objects in the set |
All types and namespaces that match the pattern. E.g. | ||
Only namespaces that match the pattern. E.g. | ||
Arrays | ||
| Leave only arrays |
Arrays, containing |
or | Leave only arrays of the specified or higher (if brackets are not closed) dimension |
Arrays with the dimension 3 and higher containing |
Three-dimensional arrays containing | ||
| Exclude arrays from the result |
Objects (excluding arrays) containing |
Ranked arrays | ||
| Leave only arrays with the specified number of elements |
Arrays with |
Two- (or more) dimensional arrays with | ||
If range is not specified, the filter is treated as a text filter. For example, | ||
Generic type arguments | ||
| Leave only types with generic type arguments |
Only objects containing |
Only objects containing | ||
or | Leave only objects with the specified number of generic type arguments |
Objects containing |
Objects containing | ||
| Exclude generic type arguments from the search scope |
Objects (that do not have generic type arguments) containing |
| Search by type, value type, method, or namespace. |
Objects containing |