Call Tree
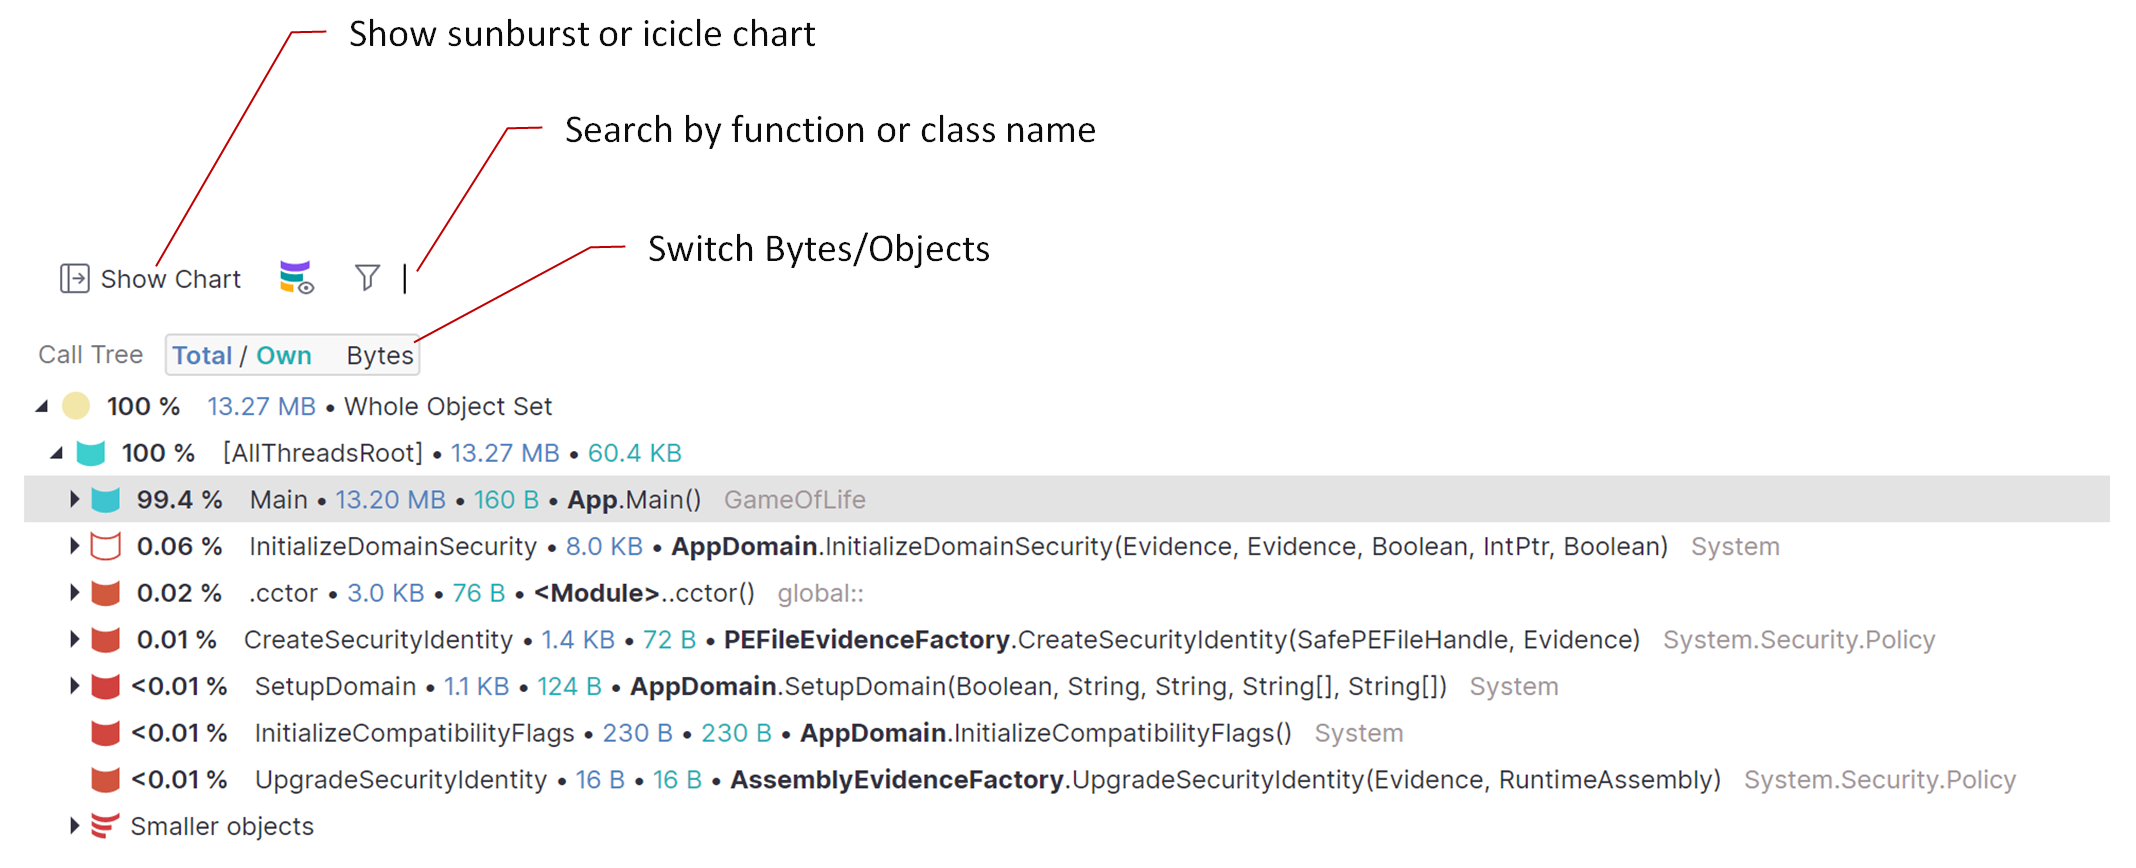
The Call Tree view shows the stack trace responsible for creating the selected object set. Use this view to answer "Which function created the object?" and identify functions that allocate too much memory.
To simplify analysis, dotMemory lets you visualize the call tree as an Icicle or a Sunburst chart.
Call Tree

Each node in the call tree represents a function call. The numbers next to the function name show either the size of objects allocated by the call or the number of these objects. To switch between these modes, use the button on the top.

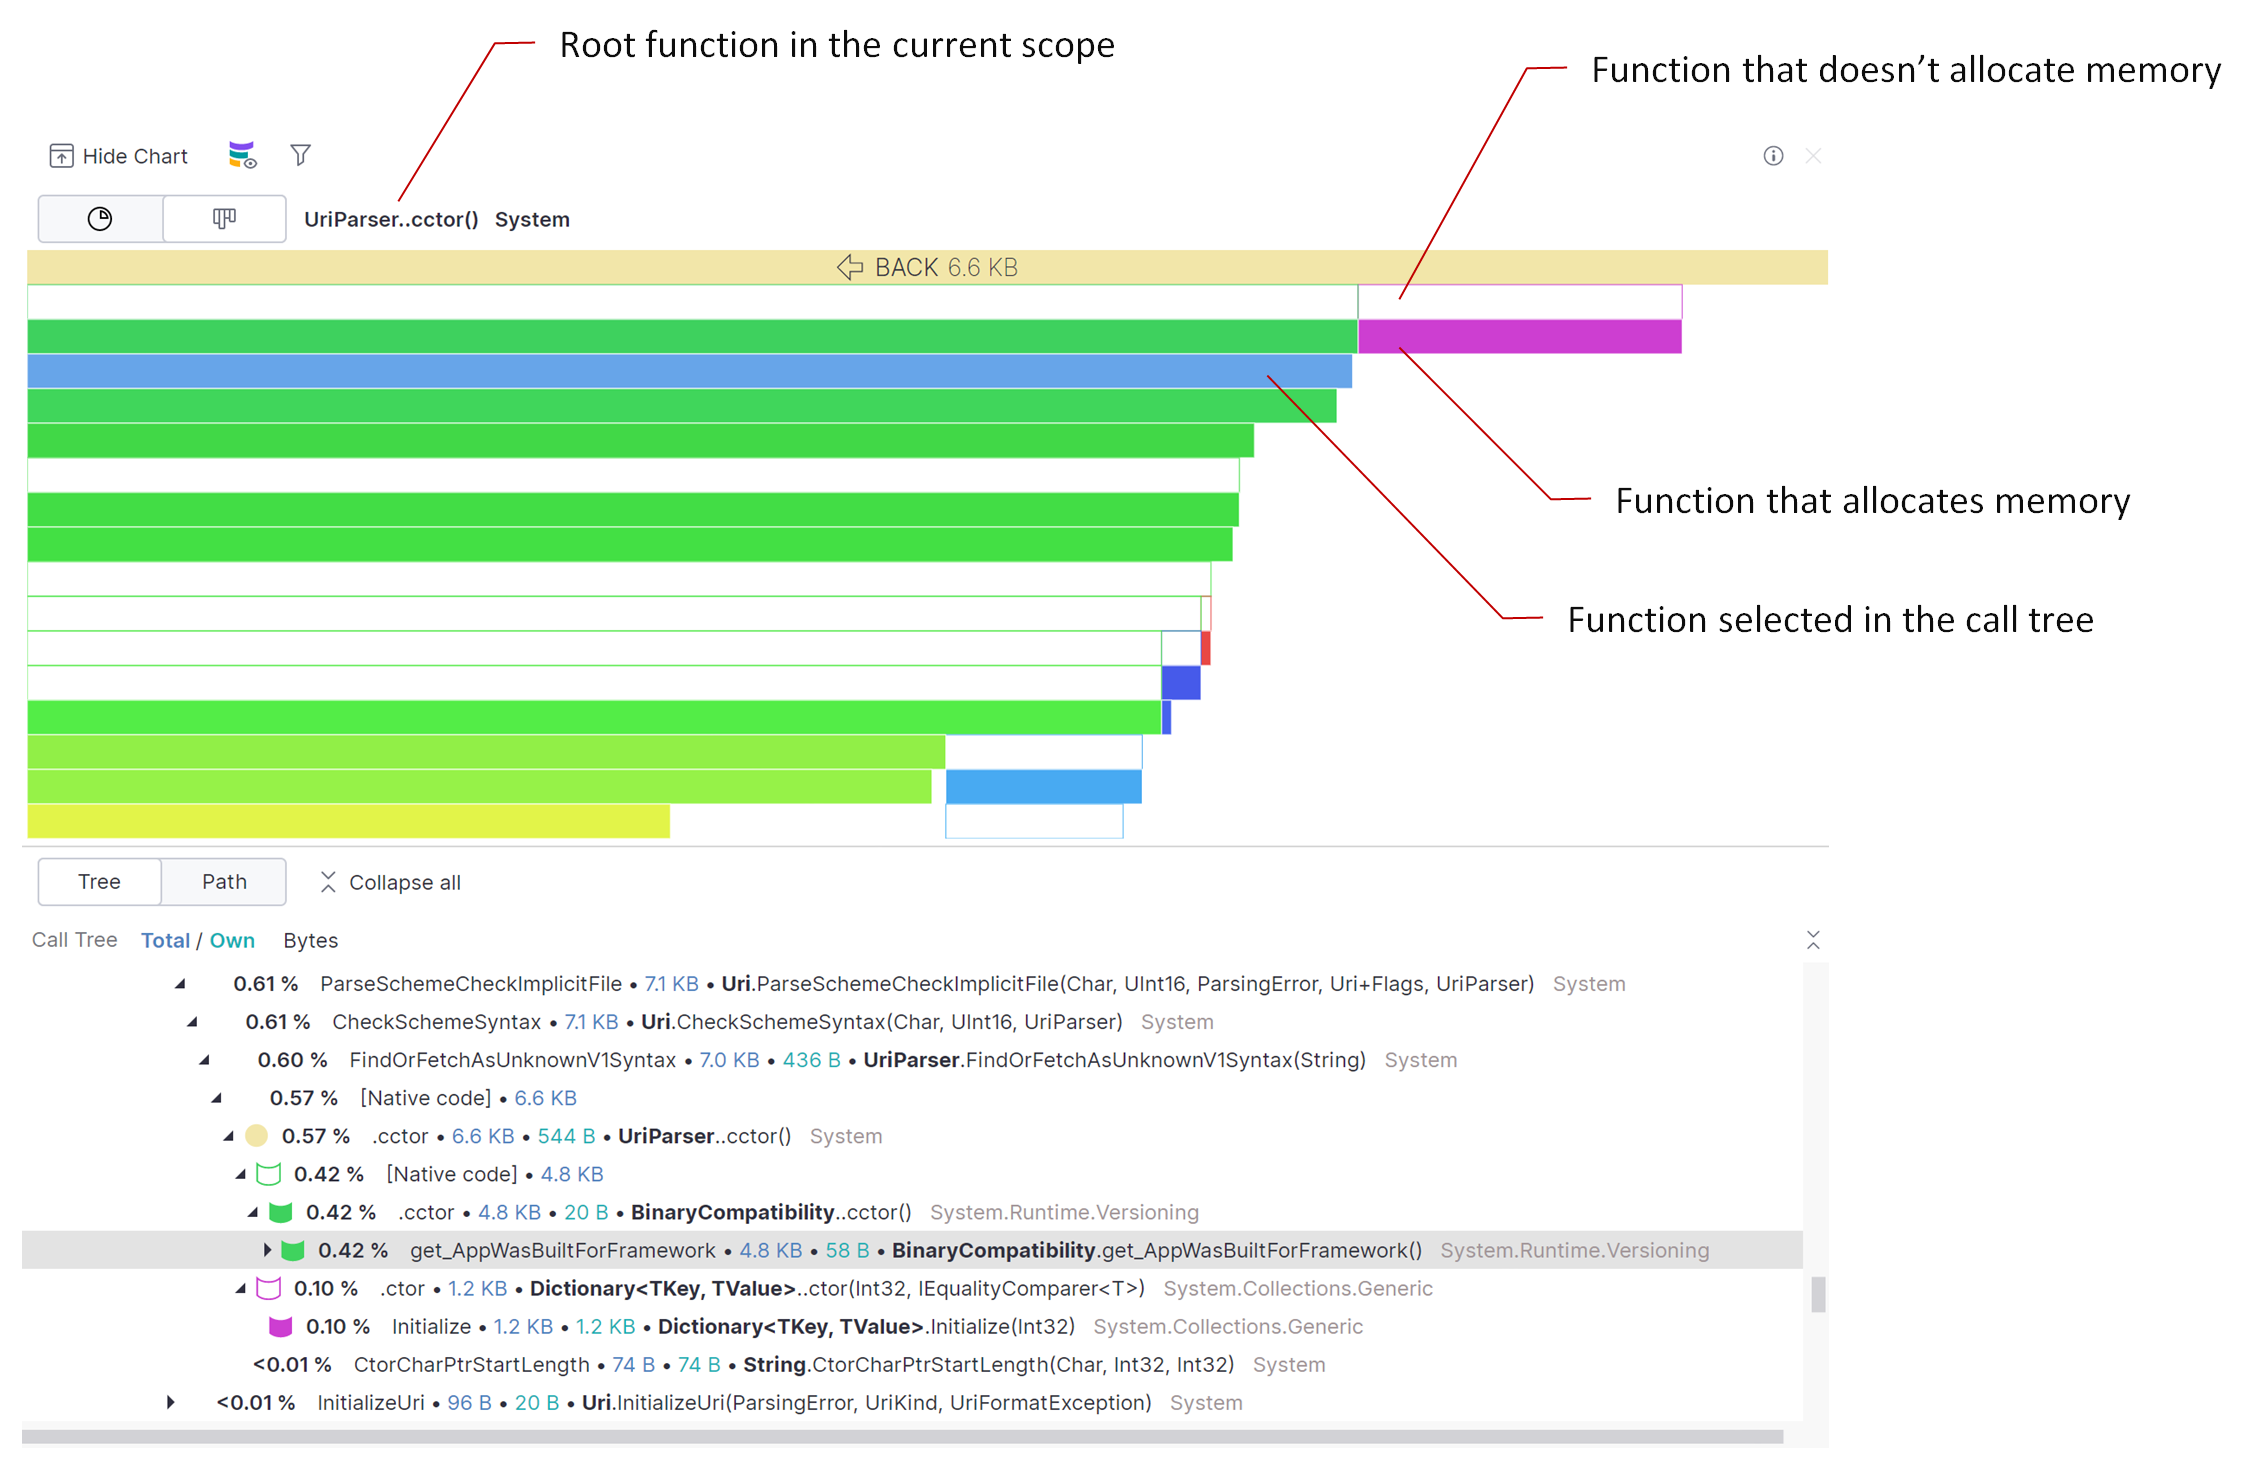
The icon represents how the function is shown on the sunburst or the icicle chart. The icon color corresponds to the color of the function on the chart. There can be the following icons:
 – the the root function in the current chart scope.
 – the function doesn't allocate objects from the selected set by itself but its subtree (child functions) does.
 – the group of functions that allocate small-size objects insignificant in the current scale.
No icon – the function is not shown on the sunburst or the icicle chart.
The percentage of the total allocated memory or the number of objects allocated by the function and its subtree.
The name of the function.
The total amount of memory (or the number of objects) allocated by the function and its subtree.
The amount of memory (or the number of objects) allocated by the function itself.
The full function name including its class.
The namespace of the function.
Find functions, classes, namespaces by name
Click on the field next to the search icon ![]() and start typing the function, class, or namespace name. The items that match the entered string will be highlighted in the call tree.
and start typing the function, class, or namespace name. The items that match the entered string will be highlighted in the call tree.

Use CamelHumps. E.g.
fowill return objects of bothSystem.Drawing.FontandMS.Utility.FrugalObjectListtypes.Use special symbols, like wildcards and others. The full list is shown in the table below.
- Special symbols and filter examples
Symbol
Description
Example
*Wildcard
*All objects in the set
sys.*.dataAll types and namespaces that match the pattern. E.g.
System.Data,System.Windows.Controls.Datagrid, andSystem.Windows.Data.Binding.sys.*.data.Only namespaces that match the pattern. E.g.
System.Windows.Data.Bindingbut notSystem.Windows.Controls.Datagrid.Arrays
[]Leave only arrays
str[]Arrays, containing
strin their type or namespace. E.g.String[].[,[,,...or
[,][,,]...Leave only arrays of the specified or higher (if brackets are not closed) dimension
str[,,Arrays with the dimension 3 and higher containing
strin their type or namespace. E.g.String[,,]andString[,,,].str[,,]Three-dimensional arrays containing
strin their type or namespace. E.g.String[,,].!aExclude arrays from the result
!a strObjects (excluding arrays) containing
strin their type or namespace. E.g.Stringbut notString[].Generic type arguments
<Leave only types with generic type arguments
str<Only objects containing
strin their type or namespace and having generic type arguments. E.g.FileStreamStorage<Char>but notList<String>.<strOnly objects containing
strin their generic type arguments. E.g.List<String>but notFileStreamStorage<Char>.<,<,,...or
<,><,,>...Leave only objects with the specified number of generic type arguments
fun<,,>Objects containing
funin their type or namespace and having three generic type arguments. E.g.Func<String, Object, Object>.fun<str,,taskObjects containing
funin their type or namespace and having three or generic type arguments that match the pattern. E.g.Func<Stream, IAsyncResult, TaskResult, EventArgs>.!gExclude generic type arguments from the search scope
!g strObjects (that do not have generic type arguments) containing
strin their type or namespace. E.g.Stringbut notList<String>.#c#struct#m#nsSearch by type, value type, method, or namespace.
#ns FeatureObjects containing
Featurein their namespace.
Select objects for further analysis
To select objects for further analysis, right-click a function in the call tree and select one of the following:
Open objects allocated by this instance of the function – to select objects allocated by a particular function instance (exact call). Alternatively, you can use Shift+click on the function call (works both in the call tree and the chart).
Open objects allocated by all functions in this subtree – to select objects allocated in a function subtree (function instance and all its child calls). Alternatively, you can use Alt+click on the function call (works both in the call tree and the chart).
Open objects allocated by all instances of the function – to select objects allocated in all instances of a function (if a function is called from different call stacks, these calls are displayed separately in the call tree).
After this, the corresponding analysis subject will be added to the Analysis Path on the left panel.
Icicle chart

In the Icicle chart, each function call is shown as a horizontal bar. The length of the bar depends on the size of objects allocated in the call's subtree. The more memory was allocated in the underlying subtree, the longer the bar. In the subtree, function calls (bars) can only reduce in size, giving the subtree a look of an icicle.
To focus on a particular call subtree, double-click the corresponding bar. The chart will zoom in on the subtree, making the selected call the root.
Sunburst chart

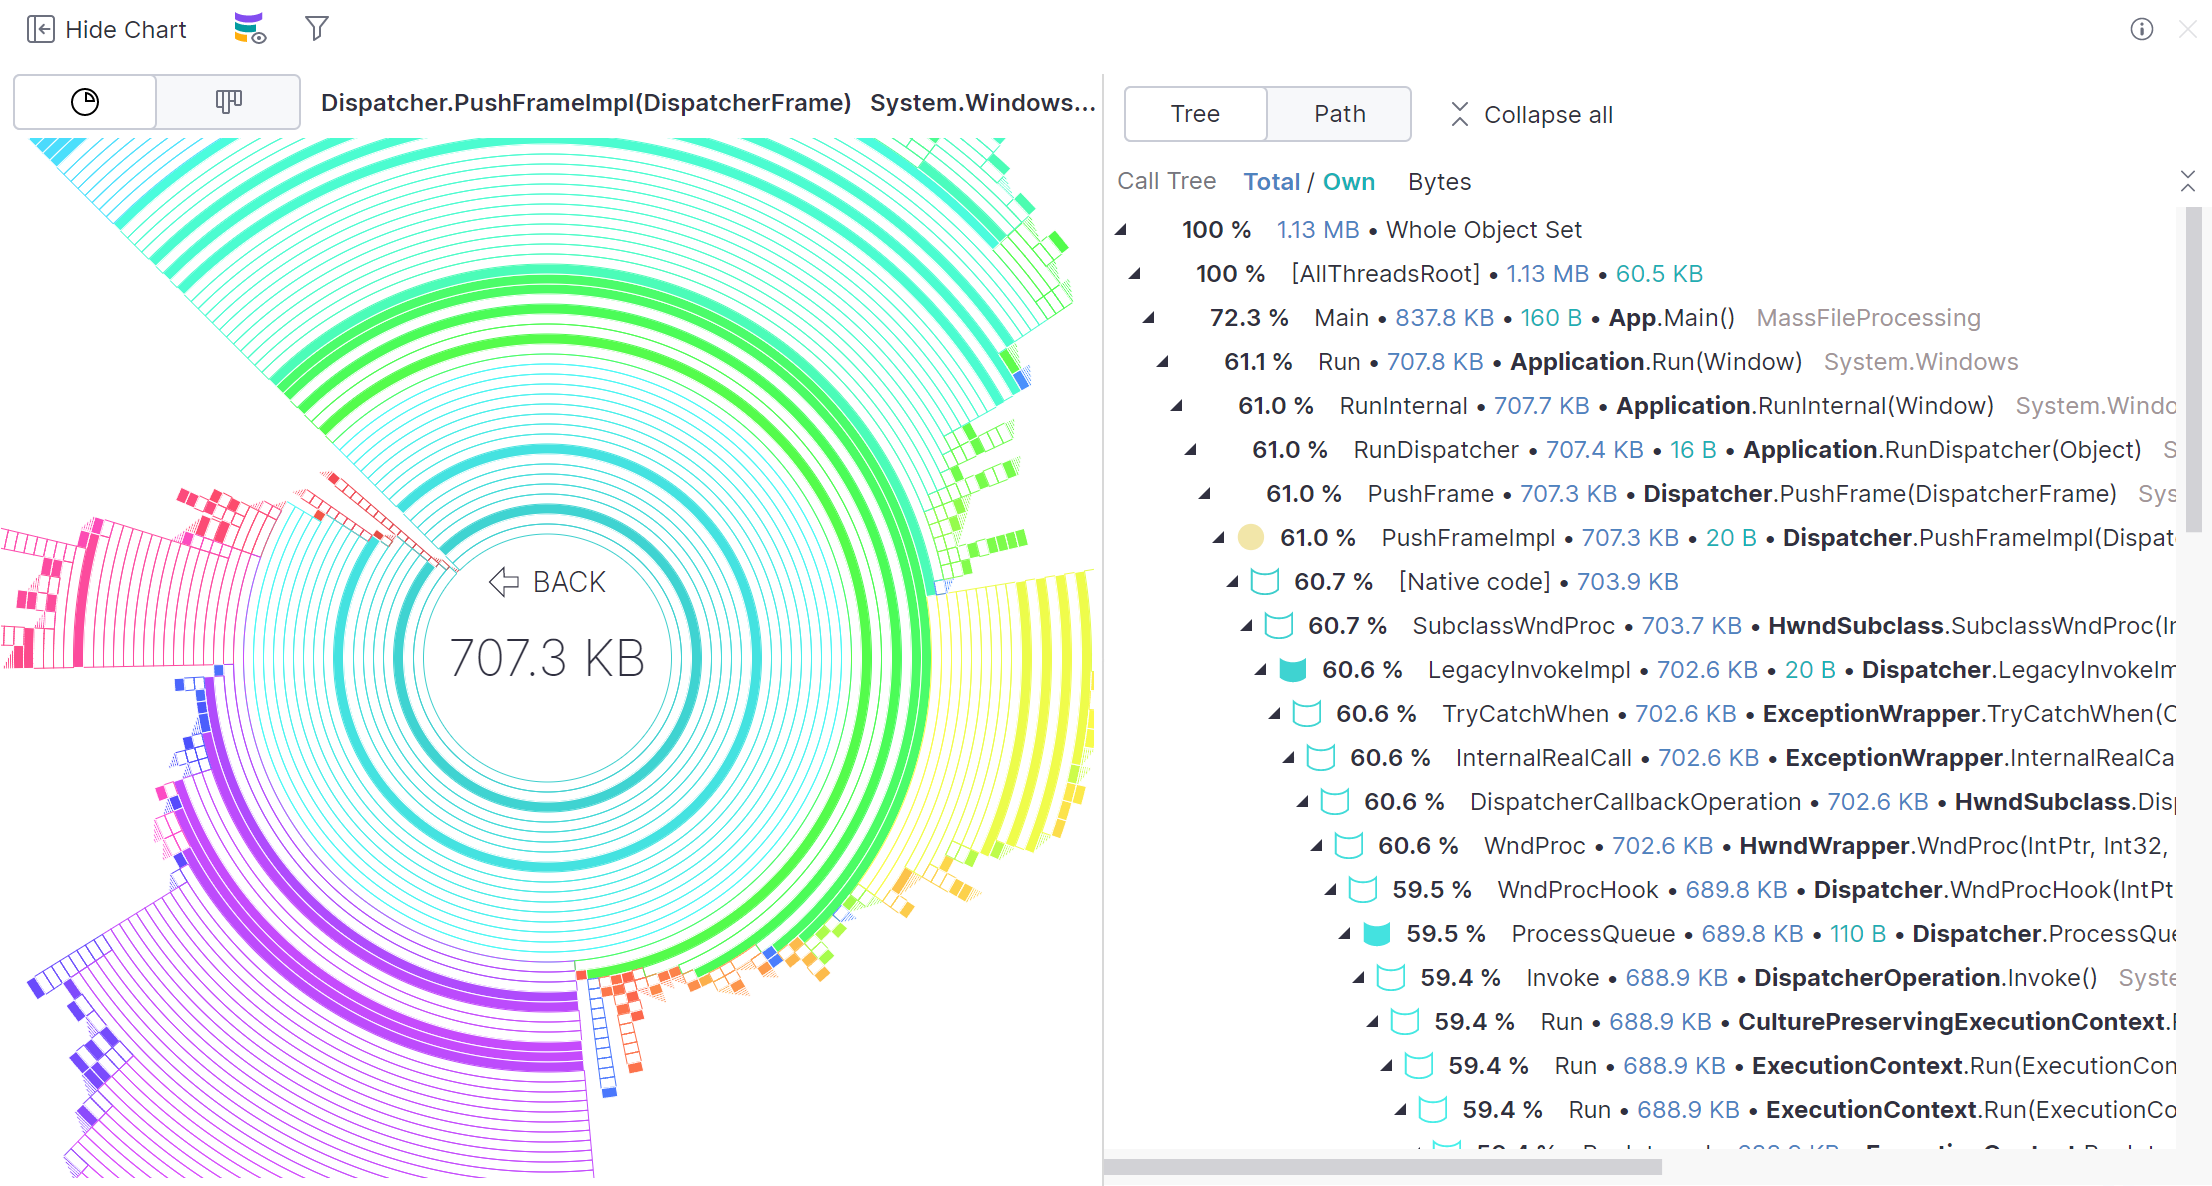
Alternatively to the Icicle chart, you can visualize the call tree as a Sunburst chart. The sunburst chart is a circular chart divided into segments, each representing a function call. The larger the central angle of a segment, the more memory is allocated within that call. As well as the Icicle chart, the Sunburst chart allows you to quickly identify the main memory generators in the stack. In terms of functionality, behavior, and data representation, the Sunburst chart is a complete counterpart of the Icicle chart.
To switch to the Sunburst chart, use the switcher on the top of the view.
When Sunburst chart is selected, you can view the call tree in two modes:
Tree – the standard call tree view.
Path – a plain list of calls that are on the path from the root call to the selected call. All calls that aren't on the path are hidden. This mode is useful when you need to concentrate on a particular call path.