Parallel stacks
Select the Parallel Stacks tab in the Debug window.
Click the thread ID in the editor:

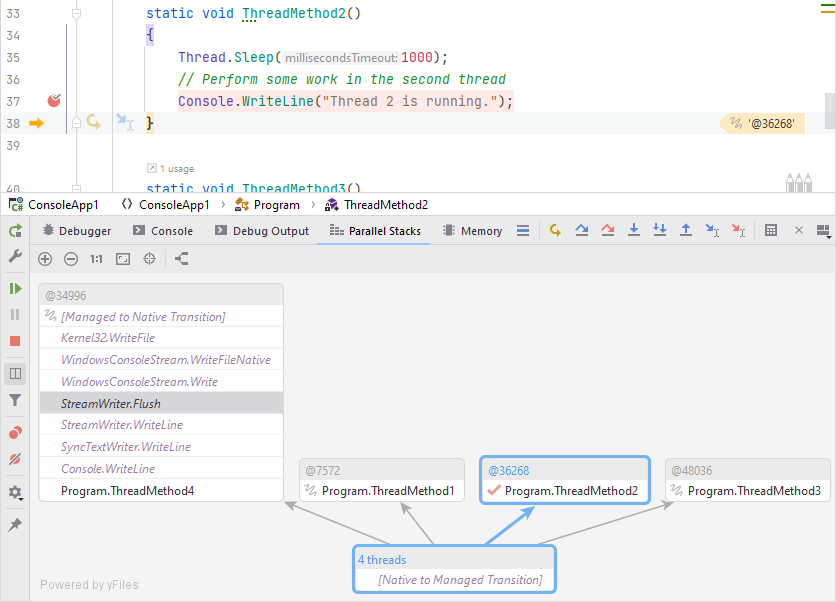
Here is an example of how Parallel Stacks look like during the debugging of a simple application that starts a number of threads:

Some notes to the image:
The call path of the current thread is highlighted blue.
indicates the execution point of the current thread.
near a method indicates that a thread has stopped on this method.