Tasks view
To get detailed information about the state of System.Threading.Tasks.Task and ValueTask objects in the current execution point of the application , use the Tasks view.
As soon as your program is suspended, you can study tasks in the corresponding tab of the Debug window Alt05.
In the table view, you can see all tasks with their current states and other details.

To locate the source code of a specific task, right-click it and choose Navigate to Task's Initial Location or Navigate to Task's Current Location.
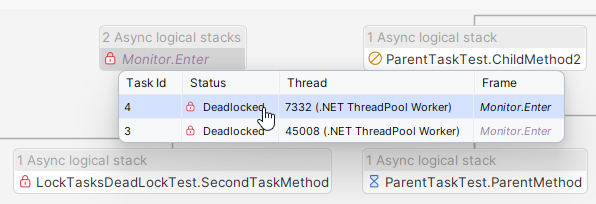
Use the selector in the top right corner to switch to the graph view:

To view the details of tasks in the graph, hover the mouse over the desired node:

For specific scenarios and use cases of the Tasks view, check out this blog post: How to use the Tasks View in JetBrains Rider.