Examine suspended program
You can examine the state of the suspended application by analyzing frames.
When the code is running in debug mode, there are two ways to suspend it:
Set breakpoints in the code that you want to examine and wait until one of them is hit.
Break program execution with Ctrl+D, P. The debugger will finish the statement that is executing at the moment you pause, and then stop at the statement that should be executed next.
In the suspended state, the current execution point — the next statement to be executed — is marked with a yellow execution pointer ![]() in the left-hand gutter of the editor. To quickly find the current execution point, press Alt+F10 or click Show Execution Point
in the left-hand gutter of the editor. To quickly find the current execution point, press Alt+F10 or click Show Execution Point ![]() in the Debug window.
in the Debug window.
What is a frame?
To perform a call to a function, the CLR generates call data and puts them to the call stack. This block of data is called stack frame (or frame for short) and includes function location, call arguments, local variables, and so on.
Explore frames
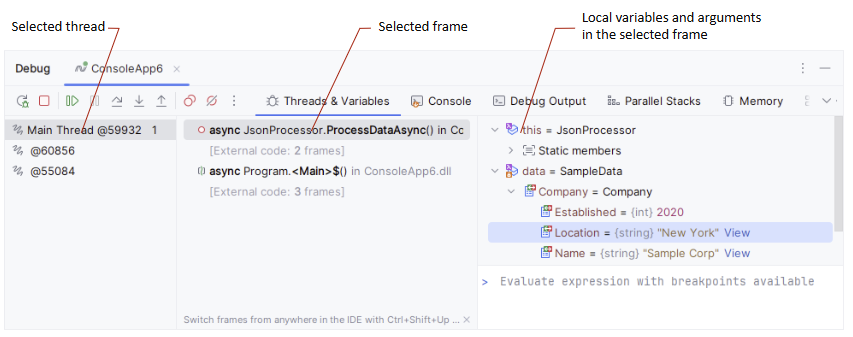
While debugging, all frames from the current call stack are displayed on the Threads & Variables pane of the Debug window, where you can select any frame and view its data.

When a frame is selected, all variables and arguments available to this frame's method call are displayed on the right-hand side, and you can explore them further.
If the call stack includes frames from library code, you may want to hide those frames and concentrate on the frames from your source code. To do so, right-click anywhere in the frame list and choose Show/Hide Library Frames.
When the Debug window is open, you can switch to the next and previous frames by pressing Ctrl+Alt+Down and Ctrl+Alt+Up.
Customize presentation of frames (Pin to frame)
By default, stack frames are listed as names of the invoked functions and their assemblies.
To add some meaningful content to the presentation of the frames (for example, to distinguish between frames of a recursively invoked function), you can use values of the call arguments or any objects accessible in the context of the function.
Select a frame in the Debug window.
In the variables view, find objects that you want to use in the frame presentation and click their icons or right-click and choose Pin to top.
The pinned objects will move to the top of the list, and their icons will be replaced with the flag icon
 . After the next step, values of the pinned objects will be used to form the string presentation of the frame where they belong. So make sure that you choose objects that have string-compatible values.
All pinned items in the solution are saved and will be also available after restart. You can see all of them in the Bookmarks window under the corresponding node.
To stop using an object in the frame presentation, click its flag icon
 in the variables view or right-click it and choose Unpin, or alternatively, locate the pinned item in the Bookmarks window and press Delete.
The following short video shows how to pin a parameter to frames of a recursively-invoked function: