Step through code
In a suspended program, you get control over the program execution. By stepping through the program, you can advance the execution point to the code you are interested in and examine the program state at this point.
When the code is running in debug mode, there are two ways to suspend it:
Set breakpoints in the code that you want to examine and wait until one of them is hit.
Break program execution with Ctrl+D, P. The debugger will finish the statement that is executing at the moment you pause, and then stop at the statement that should be executed next.
In the suspended state, the current execution point — the next statement to be executed — is marked with a yellow execution pointer ![]() in the left-hand gutter of the editor. To quickly find the current execution point, press Alt+F10 or click Show Execution Point
in the left-hand gutter of the editor. To quickly find the current execution point, press Alt+F10 or click Show Execution Point ![]() in the Debug window.
in the Debug window.
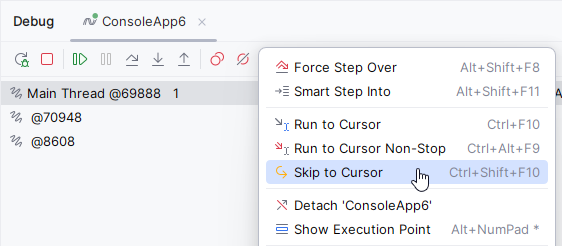
All stepping commands are available in the Run menu, via shortcuts, and with buttons on the Debug window toolbar:

Below is a brief summary of all stepping commands.
Command | Icon | Shortcut | Use it to... |
|---|---|---|---|
| F7 | stop at the first statement of the first function called from the current line | |
Shift+F7 | choose a function to step into if there are several calls in the current line | ||
| Shift+F8 | run the current function to the end and stop at the statement that follows the function call in the caller's context (or at the first breakpoint on the way, if any) | |
| F8 | execute the current statement and all functions that it calls, and then stop before the next statement (or at the first breakpoint on the way, if any) | |
| Alt+Shift+F8 | step to the next statement as Step Over does, but also ignore all breakpoints in the called methods, if any | |
| Alt+F9 | resume program execution and then stop before the target statement (or at the first breakpoint on the way, if any) | |
| Ctrl+Alt+F9 | execute code until the target statement as Run to Cursor does, but also ignore all breakpoints on the way | |
| Ctrl+Alt+Shift+F9 | make the target statement the next to be executed, skip all code between the current and the target statements |
To finish the debugging session, press Ctrl+F2, select in the menu, or click Stop in the Debug window.
Step Into
When you need to debug a function called from the current line, you can step down into the call chain with the Step Into ![]() command F7 that is available in the Run menu and in the Debug window.
command F7 that is available in the Run menu and in the Debug window.
The debugger will set the execution pointer at the first statement of the first function called from the current line. If no function is called, then the debugger will step to the next statement.
By default, JetBrains Rider enables external-source debugging, which means that when you step into the library code it will be automatically decompiled and the debugger will move the execution point there.
If you want the debugger to ignore the library code, you can disable external-source debugging —clear Enable external source debug on the page of JetBrains Rider settings Ctrl+Alt+S.
Smart Step Into
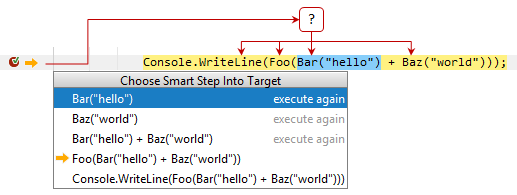
If the current line contains several nested calls, JetBrains Rider lets you choose a call to step into. Consider the following code line:
The line contains several calls and if you use Step Into, the debugger will first step into the implementation of Bar(), then into the implementation of Baz() and so on.
If you want to choose which of the calls should be stepped into, for example, Bar(), you can use Smart Step Into Shift+F7:

When you choose the function to step into, the debugger will set the execution pointer at the first statement of the selected function.
The selector also shows you which of the calls were already executed and allows you to execute these calls again.
You can enable the 'smart step into' behavior when you invoke Step Into F7 in a line that contains multiple method calls. To do so, select Always do smart step into on the Build, Execution, Deployment | Debugger | Stepping settings page Ctrl+Alt+S.
Step Out
If you no longer want to debug a function (for example, the one you've just stepped into), use the Step Out ![]() command Shift+F8 that is also available in the Run menu and in the Debug window.
command Shift+F8 that is also available in the Run menu and in the Debug window.
The debugger will execute the remaining lines of the function by itself and set the execution pointer at the statement following the function call.
Step Over
If you are not interested in how a particular function works, you can skip it over (the function will still be executed) — use the Step Over ![]() command F8that is also available in the Run menu and in the Debug window.
command F8that is also available in the Run menu and in the Debug window.
Force Step Over
If a function you want to step over contains breakpoints, the debugger will stop on those breakpoints if the corresponding statements are executed. You can force the debugger to skip breakpoints inside the call chain with the Force Step Over ![]() command Alt+Shift+F8that is also available in the Run menu and in the Debug window.
command Alt+Shift+F8that is also available in the Run menu and in the Debug window.
Run to Cursor
As an alternative to setting a breakpoint at a specific statement, resuming the program, and then waiting for the breakpoint to be hit, you can tell the debugger to just run to this statement with the Run to Cursor ![]() command Alt+F9that is also available in the Run menu and in the Debug window.
command Alt+F9that is also available in the Run menu and in the Debug window.
You can also hover over the target statement and then pick the corresponding action:

Run to Cursor Non-Stop
If there are breakpoints between the current execution point and the target statement, you can force the debugger to skip these breakpoints with the Run to Cursor Non-Stop ![]() command Ctrl+Alt+F9that is also available in the Run menu and in the Debug window.
command Ctrl+Alt+F9that is also available in the Run menu and in the Debug window.
Skip to Cursor
Instead of running the program up to the target statement, you may want to skip a part of code without actually executing it (for example, to avoid a known bug or not to repeat some routine). You can do this with the Skip to Cursor ![]() command Ctrl+Alt+Shift+F9that is also available in the Run menu and in the Debug window.
command Ctrl+Alt+Shift+F9that is also available in the Run menu and in the Debug window.
You can also skip a part of the program by dragging the execution pointer ![]() with your mouse and dropping it to the target line:
with your mouse and dropping it to the target line:

Remember the following when you jump to another statement:
Statements between the old and the new execution points are not executed.
You can jump back, that is to a statement that was already executed. In this case the already executed statements are not undone.
It is impossible to set the next statement in another function.
Stepping time
As you step through the code or let the program execute between breakpoints, JetBrains Rider visualizes the time elapsed since the last stop:

Time calculation starts at the previous debugger pause, which can be the previous breakpoint, the destination spot of the previous stepping command, or the explicit debugger pause.