Tutorial: Debug JavaScript in a Rails application
RubyMine provides the capability to debug client-side JavaScript code in a Rails application. In this tutorial, we'll show you how to debug JavaScript in Chrome. We'll use a sample Rails application with a JavaScript asset created in the Add a JavaScript asset to a Rails application tutorial. This application uses Webpacker to manage JavaScript modules.
Clone the sample Rails app
To clone the sample Rails application, follow the steps below:
Check out the sample application as described in Check out a project from a remote host (git clone). In the URL field, insert the following address: https://github.com/rubyminedoc/rails_helloworld.git.
Switch to the javascript branch.
Specify the Ruby interpreter and install dependencies:
Enable the JavaScript debugger
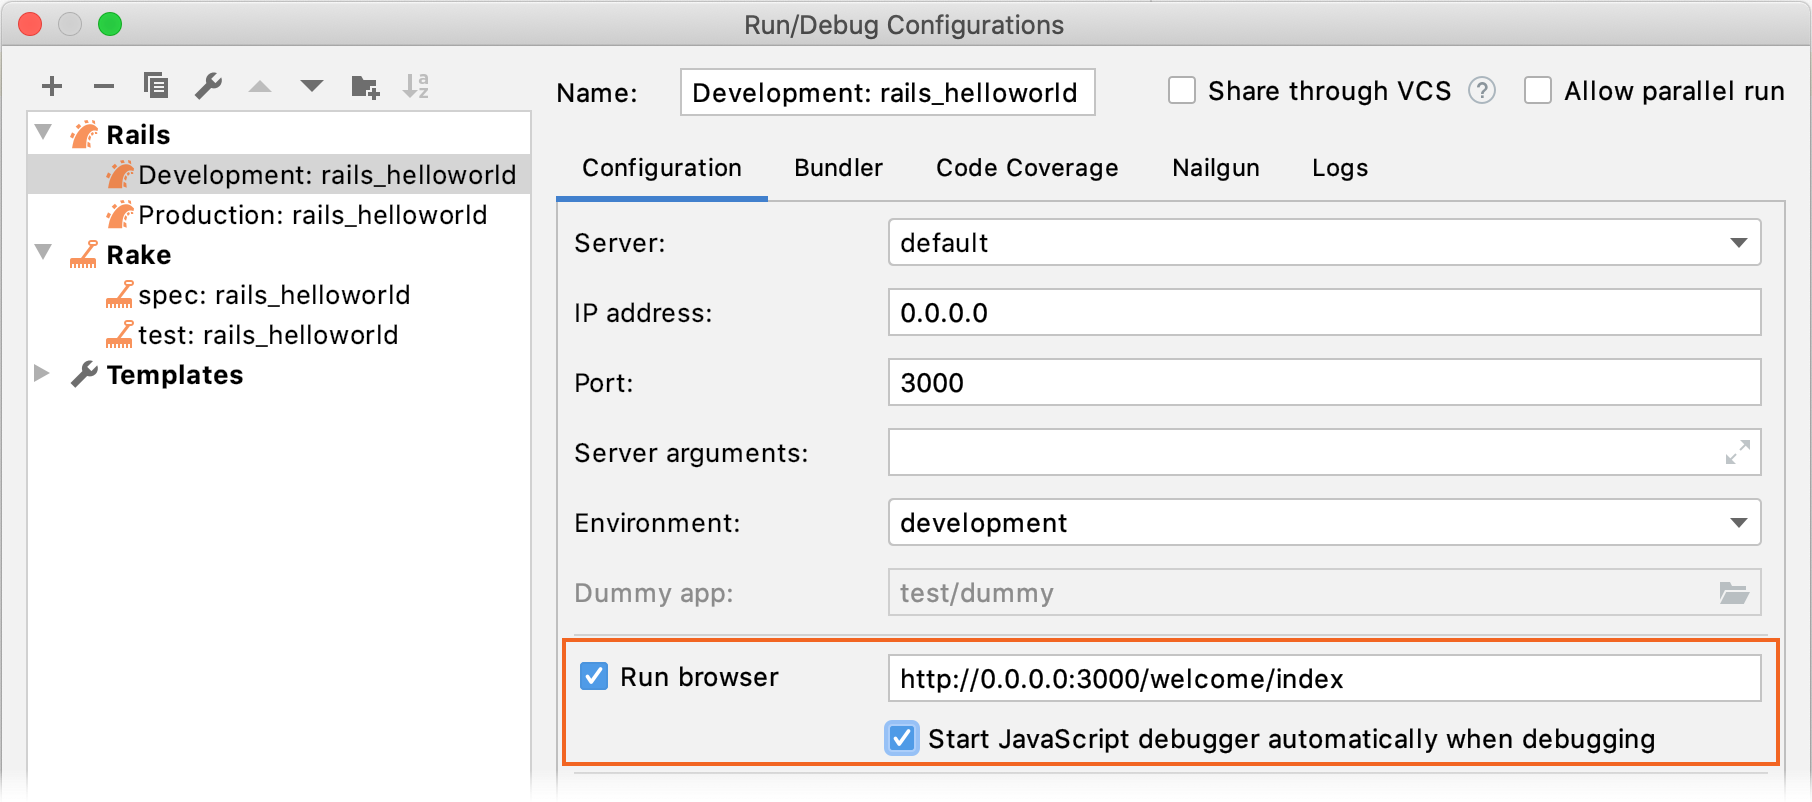
RubyMine uses run/debug configurations as a unified way to run and debug applications. For Rails projects, RubyMine automatically creates the development and production run/debug configurations with the corresponding Rails environments. To debug JavaScript, we need to enable automatic running of the JavaScript debugger in the Rails configuration.
Go to , and choose the automatically created Development: rails_helloworld configuration in the Rails group.
Specify the following options:

Enable the Run browser option and specify the following address: http://0.0.0.0:3000/welcome/index. This URL will be used to open the app/views/welcome/index.html.erb view referencing a debugged JavaScript asset.
Enable Start JavaScript debugger automatically when debugging.
Start debugging
To debug JavaScript code, follow the steps below:
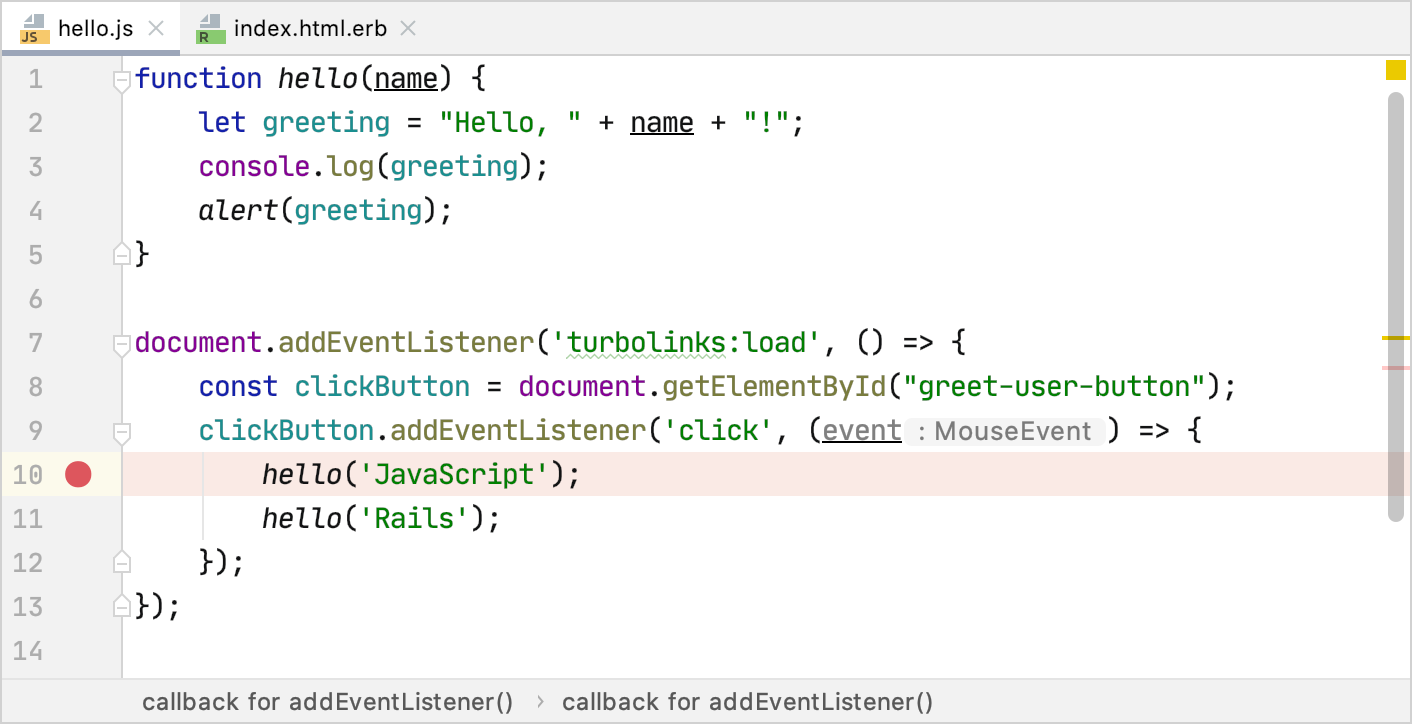
Open the app/javascript/packs/hello.js file and set a breakpoint on the first
hellofunction call.
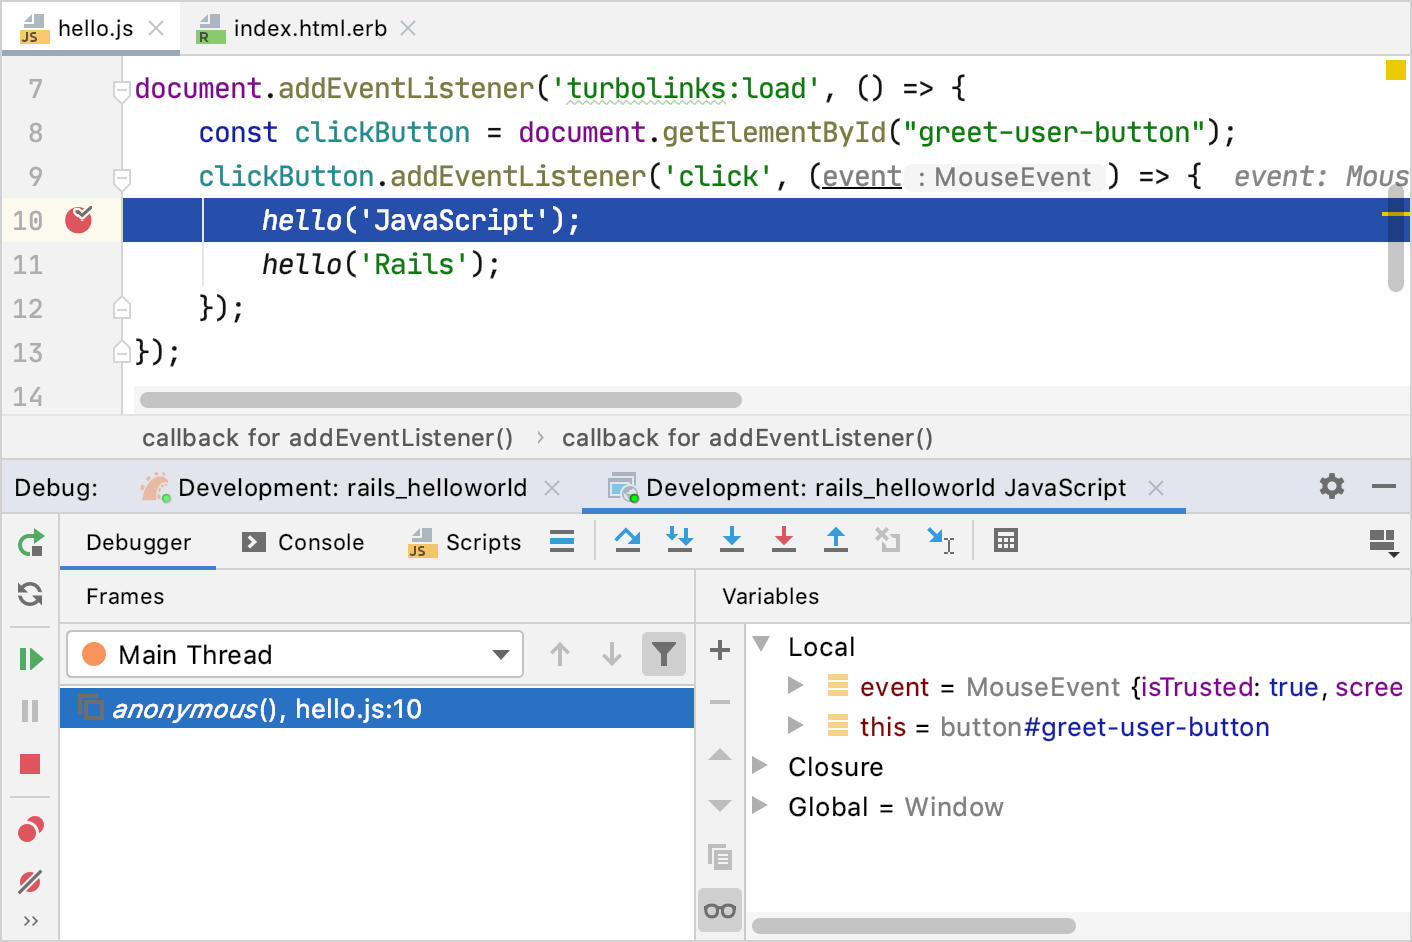
To start debugging, press Ctrl twice and start typing the configuration name in the popup: Development: rails_helloworld. Then, select this configuration, press and hold down the Shift key (the dialog title changes to Debug) and press Enter.
In the opened http://0.0.0.0:3000/welcome/index page, click the Hello! button. The debugger pauses its session on a breakpoint and enables you to examine the application state. You can learn more about debugging JavaScript from Debug JavaScript in Chrome.
