Problems tool window
View | Tool Windows | Problems
Alt06
Problems tool window show the detected issues in the currently opened file and in the whole project, as well as the results of code inspections you run manually.
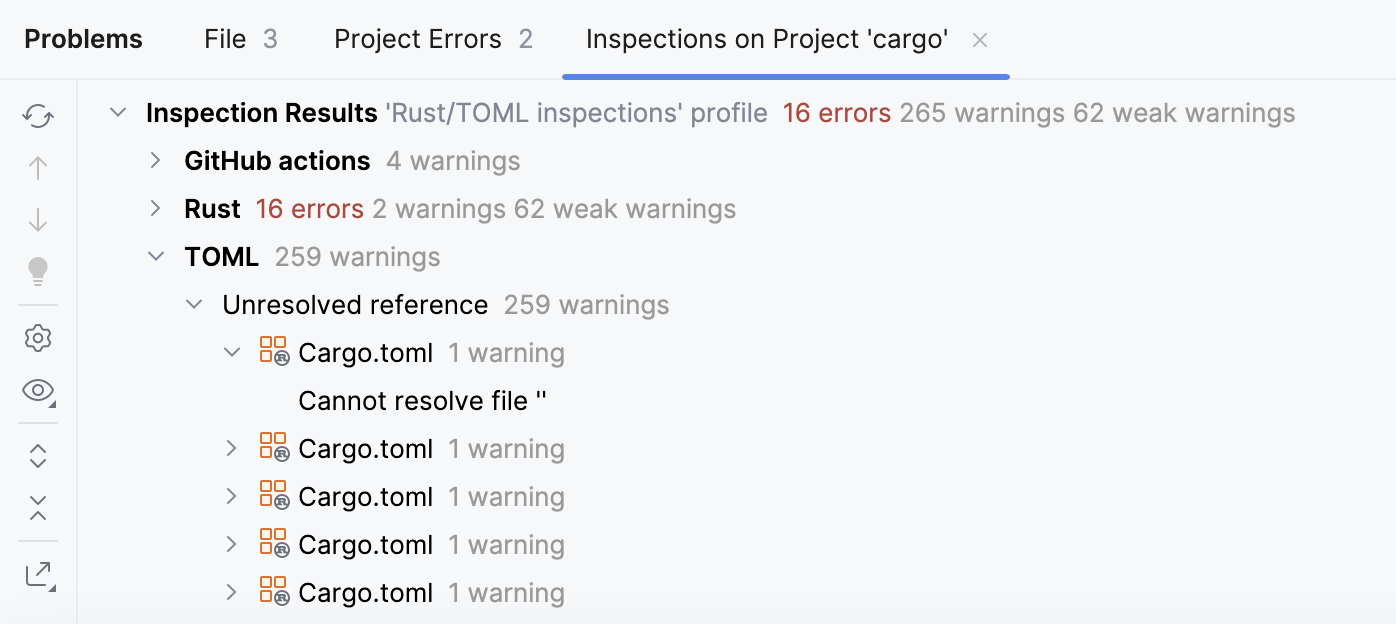
You can select any problem in the window and press F4 or double-click it to jump to the corresponding line in the editor.
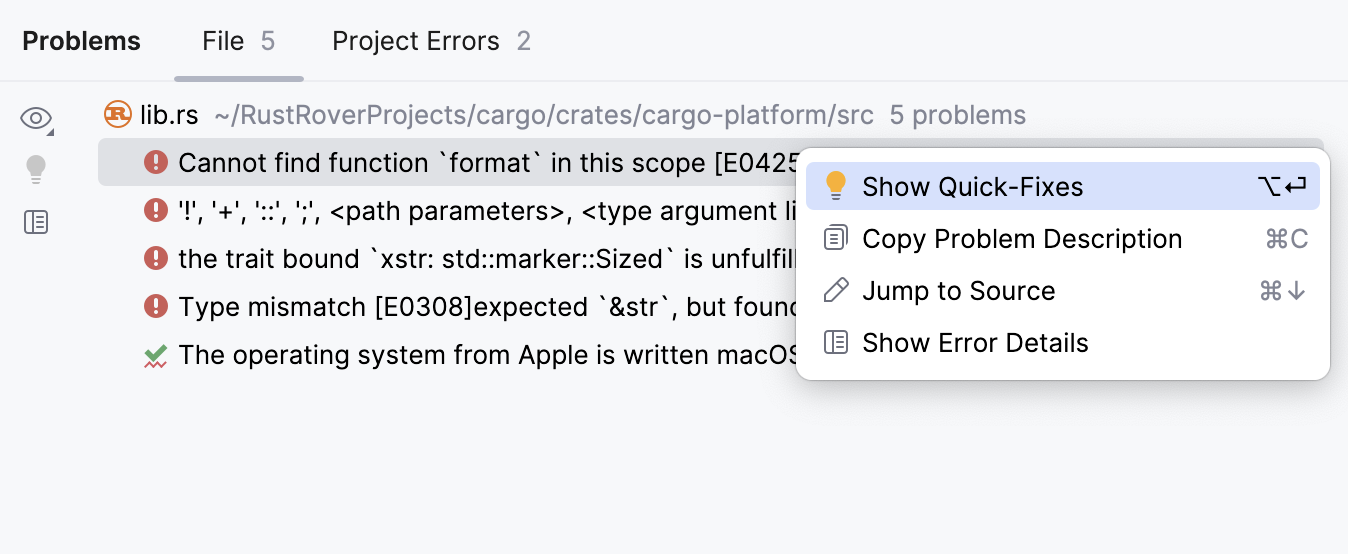
The IDE continuously checks your code and searches for problems. This tab lists all code issues found in the current file. The list is updated as you switch between files in the editor.
Item | Tooltip and shortcut | Description |
|---|---|---|
View Options | Filter out code issues by their severity and configure their sorting. When no grouping or sorting options are selected, the issues are listed in the order they appear in the file. | |
Show Quick-Fixes AltEnter | Show quick-fixes available for the selected problem. | |
Open Editor Preview | Open the preview pane to view the selected issue in its source context right in the Problems window. Note that this preview is a normal editor where you can change the code and apply available quick-fixes. |
Item | Shortcut | Description |
|---|---|---|
Show Quick-Fixes | AltEnter | Show quick-fixes available for the selected problem. |
Copy Problem Description | Ctrl0C | Copy the problem description to the clipboard. |
Jump to Source | F4 | Open the code containing the problem in the editor. |
Show Error Details | Open error details in a separate dialog. |
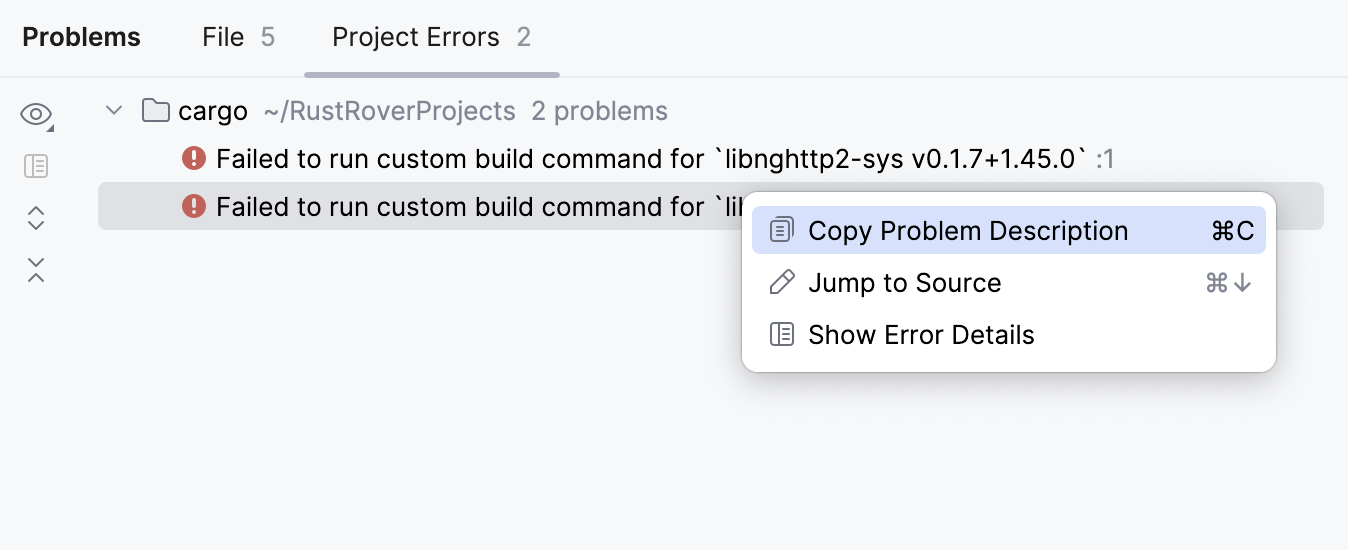
This tab displays problems detected across your project by the project-wide analysis.
Item | Tooltip and shortcut | Description |
|---|---|---|
View Options | Filter out code issues by their severity and configure their sorting. When no grouping or sorting options are selected, the issues are listed in the order they appear in the file. | |
Show Quick-Fixes AltEnter | Show quick-fixes available for the selected problem. | |
Open Editor Preview | Open the preview pane to view the selected issue in its source context right in the Problems window. Note that this preview is a normal editor where you can change the code and apply available quick-fixes. | |
Expand All | Expand all nodes. | |
Collapse All | Collapse all nodes. |
Item | Shortcut | Description |
|---|---|---|
Copy Problem Description | Ctrl0C | Copy the problem description to the clipboard. |
Jump to Source | F4 | Open the code containing the problem in the editor. |
Show Error Details | Open error details in a separate dialog. |
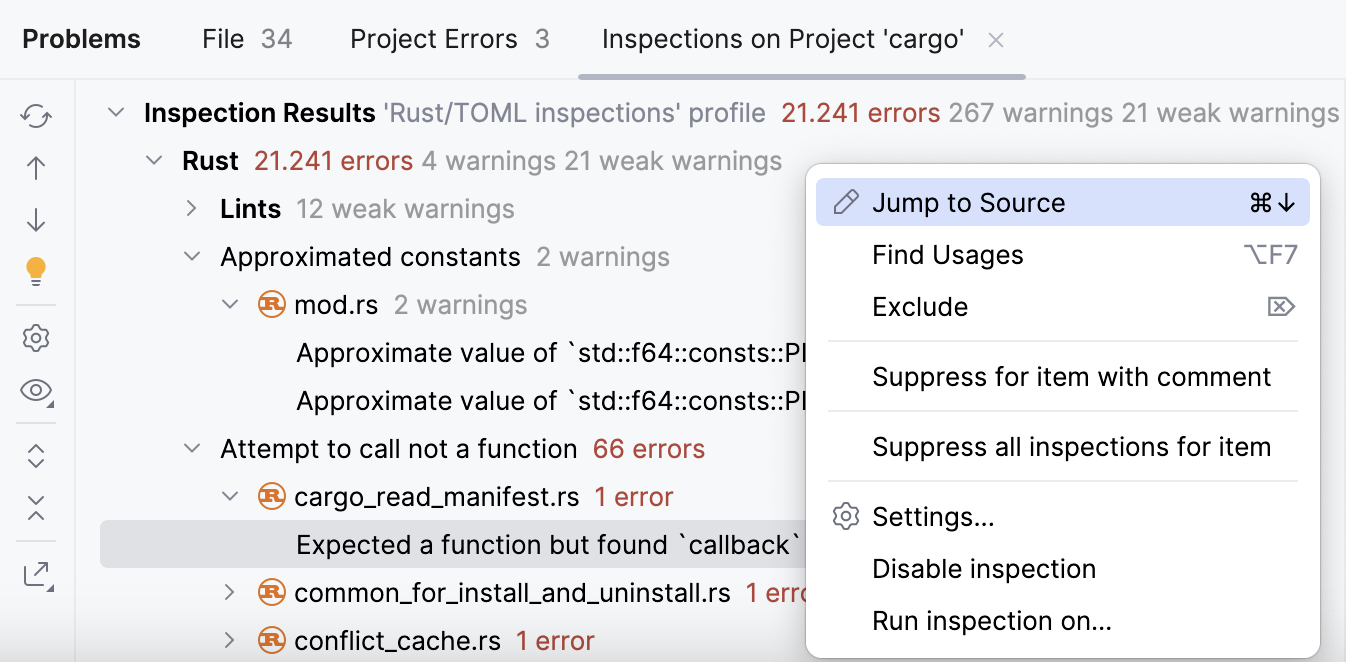
This tab appears when you run code inspections manually and shows the analysis results.
Item | Shortcut | Description |
|---|---|---|
CtrlF5 | Run the inspection and show the results on the same tab. | |
CtrlAlt0↑ | Navigate to the previous problem. | |
CtrlAlt0↓ | Navigate to the next problem. | |
AltEnter | Resolve the problem for the selected inspection item by choosing one of the available quick fixes from the list. | |
Change the settings for the selected inspection or group of inspections in the Errors dialog. | ||
Group or filter found problems according to the selected option:
| ||
CtrlNumPad + | Expand all nodes. | |
CtrlNumPad - | Collapse all nodes. | |
Export the inspection results into XML or HTML format. |
Item | Shortcut | Description |
|---|---|---|
Jump to Source | F4 | Open the file that contains the selected problem in the editor and place the caret at the beginning of the corresponding code fragment. |
Exclude | Delete | Exclude the selected items from further examination. Excluded nodes are shown strikethrough. If the filter toggle |
Include | Insert | Include previously excluded items in the list of results. All nested elements are included too. |
| AltEnter | Select one of the suggested solutions. |
Suppress problem | Suppress the inspection for the selected problem. | |
Edit Settings | Change the settings for the selected inspection or group of inspections in the Errors dialog. | |
Disable inspection | Disable alerts for the selected inspection in the active tab of results. If the filter toggle | |
Run inspection on | Rerun the selected inspection and display the results on a new tab. |
Reports Rustfmt errors.
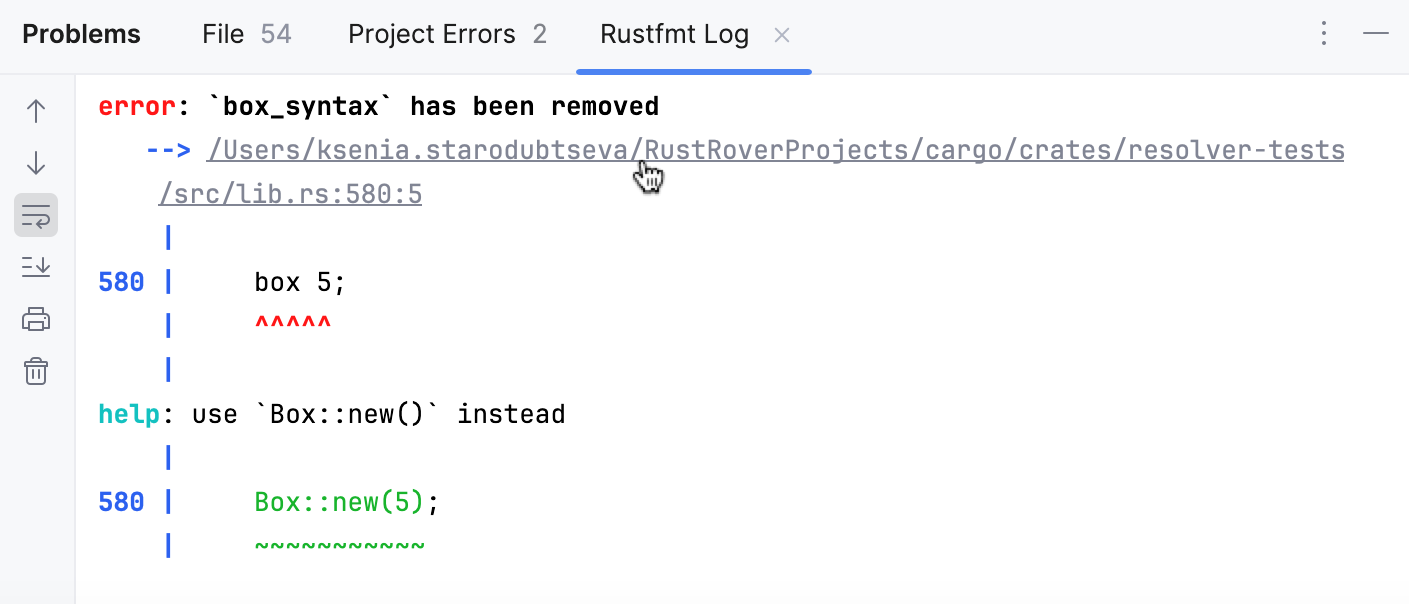
The tab appears when RustRover applies Rustfmt to a file (either triggered by the user or on saving), and Rusfmt encounters error(s). To access the tab, follow the link in the notification:

Thanks for your feedback!