TeamCity Experimental UI
In version 2019.1, TeamCity introduced an experimental UI option as an alternative to the classic UI. Our experimental UI is a work in progress: we present the changes in functionality in the early stages of development so you can benefit from the new features as soon as possible. Based on our vision and your feedback, we are constantly releasing new UI features and improving existing ones.
Our goal is to provide a support for all the important classic features in the new UI before making it a default option. However, many users of TeamCity have successfully switched to the new UI already and use it in terms of their production pipeline.
We encourage you to try the TeamCity experimental UI and leave your feedback via our UI survey.
When you sign in to TeamCity for the first time, it automatically offers you to switch to the experimental UI and remembers your choice.
You can change the default UI representation anytime in Your Profile | General via the Use experimental UI checkbox.
Any page that supports the experimental UI has a toggle that allows quickly accessing a UI mode alternative to the default one. For example, if you miss any of the familiar classic options in the new UI, you can switch the page to the classic UI with the ![]() button. To return to the experimental UI, click
button. To return to the experimental UI, click ![]() .
.
Currently, the experimental UI is available for the following pages:
Project Home and Build Configuration Home pages: redesigned Overview tab
Build Results page: redesigned Overview, Tests (and Test History, Changes, Build Log, and Dependencies tabs
Agents page
Queue page
Each experimental page comes with a handy sidebar that serves for quick navigation and preview of build/agent statuses.
Below, you can find a recap of these features. Please note that the described functionality is a work in progress. In case you face any unpredictable behavior in the new UI, feel free to contact us via our feedback channels.
The Overview tab of the experimental Project Home page strives to provide more visibility of the project's nested subprojects and build configurations. The page has two main views: Builds and Trends.
The Builds view resembles the classic UI and displays a list of the recent builds in subprojects and build configurations of the current project.
The Trends view comprises cards that represent build configurations, grouped by their projects. Each card contains a preview of the most recent builds displayed as bars on a timescale. You can hover over any bar to instantly see more information about the build: its duration, queue statistics, test results, used agent, and more. The card also displays the number of pending changes.
The Trends view of the Project Home:
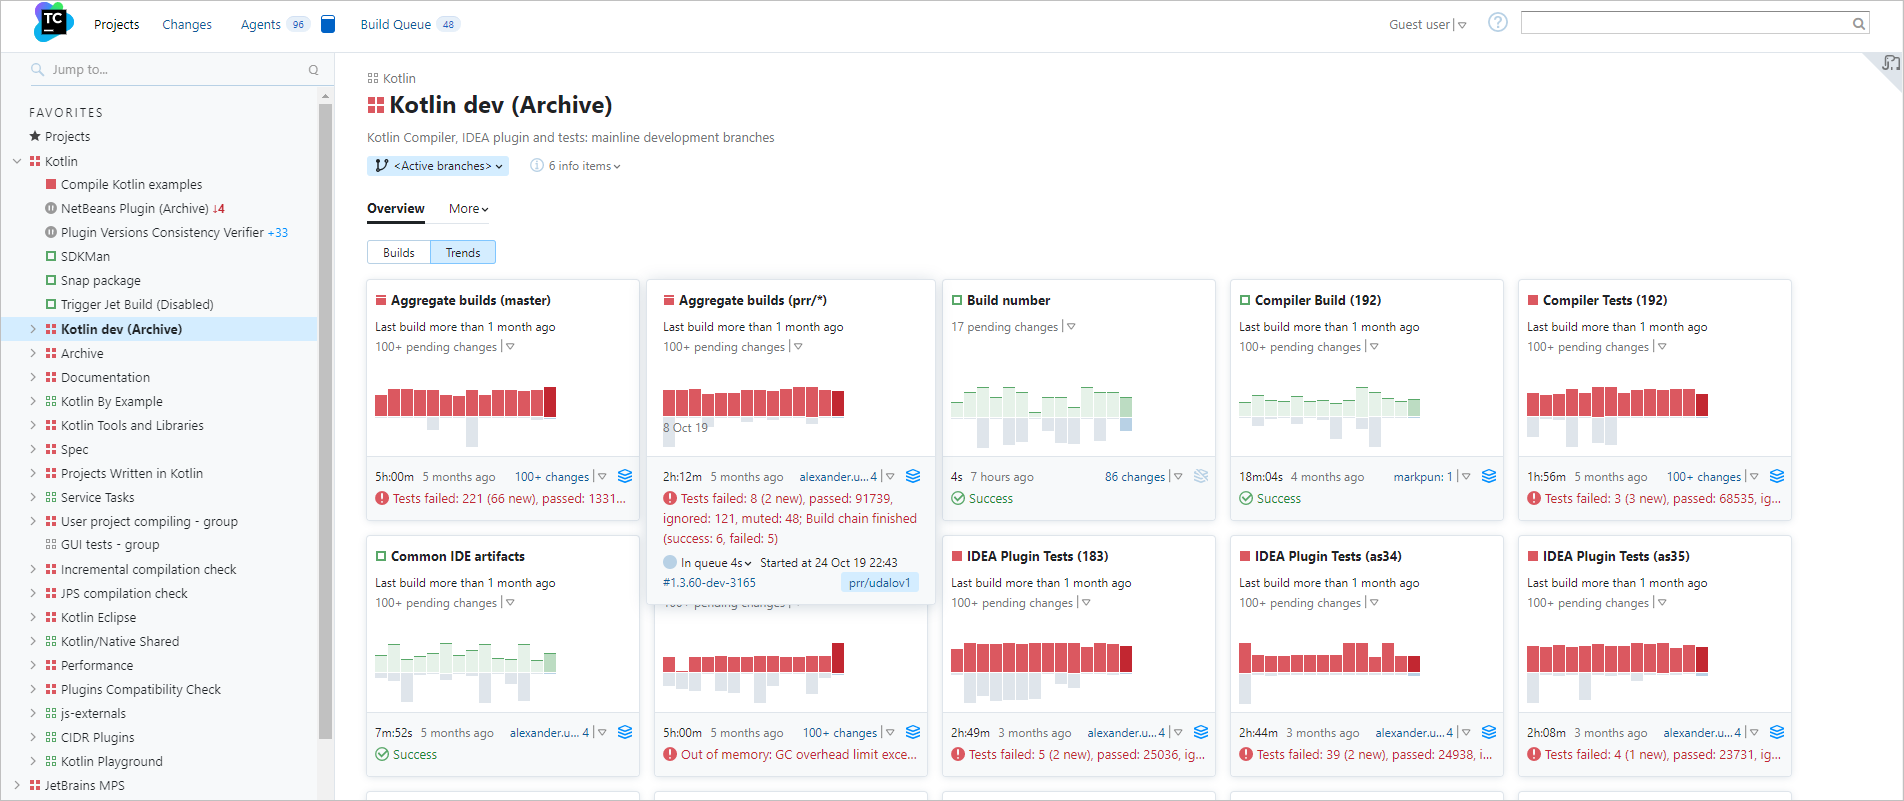
All the classic UI tabs are also available on the experimental page: click More and select the required tab in the list.
The Overview tab of the experimental Build Configuration Home page provides two already familiar views: Builds, listing all the recent builds of the configuration, and Branches, listing the recent builds in active branches.
Every build item in the list is expandable: click it to preview the most important information about the build and get quick access to any of the Build Results tabs.
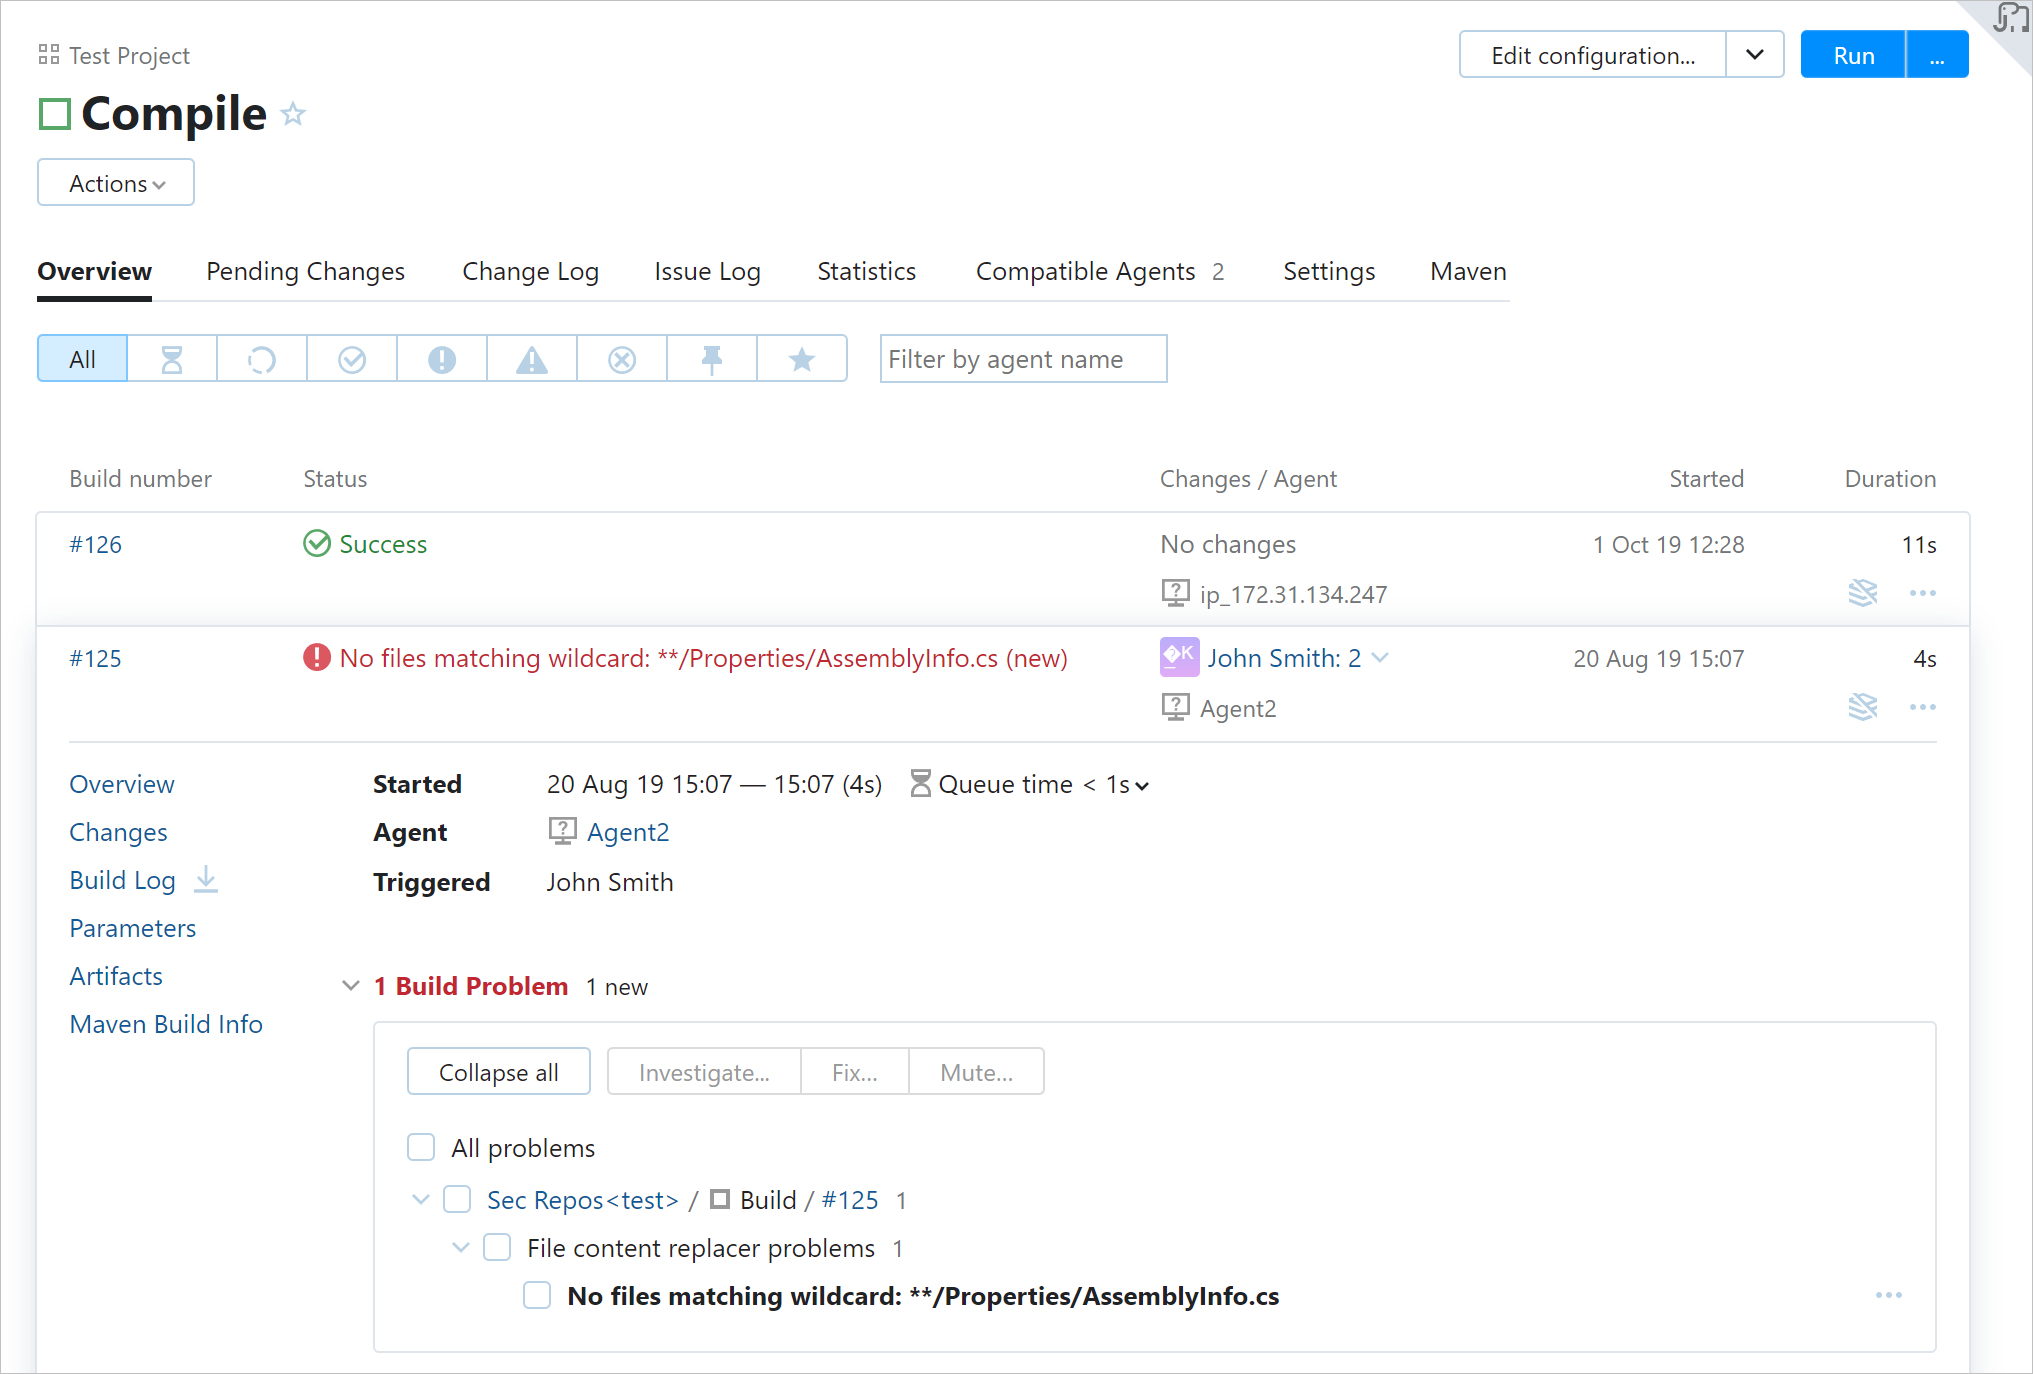
Click a specific build problem or failed test to see the related stack trace:

Click Open in build log to open the new build log exactly at the line where the problem occurred.
The Changes pop-up block has also been reworked. Now, build changes are sorted chronologically and grouped by their origin: user commits to the code and changes in artifact dependencies. You can also filter the changes by their author and display changes made in the build configuration settings.
Example of the Changes pop-up block:

All the classic UI tabs of Build Configuration Home are also available on the experimental page: click More and select the required tab in the list.
The new Build Results page offers better visualization of the build results and provides a few handy widgets.
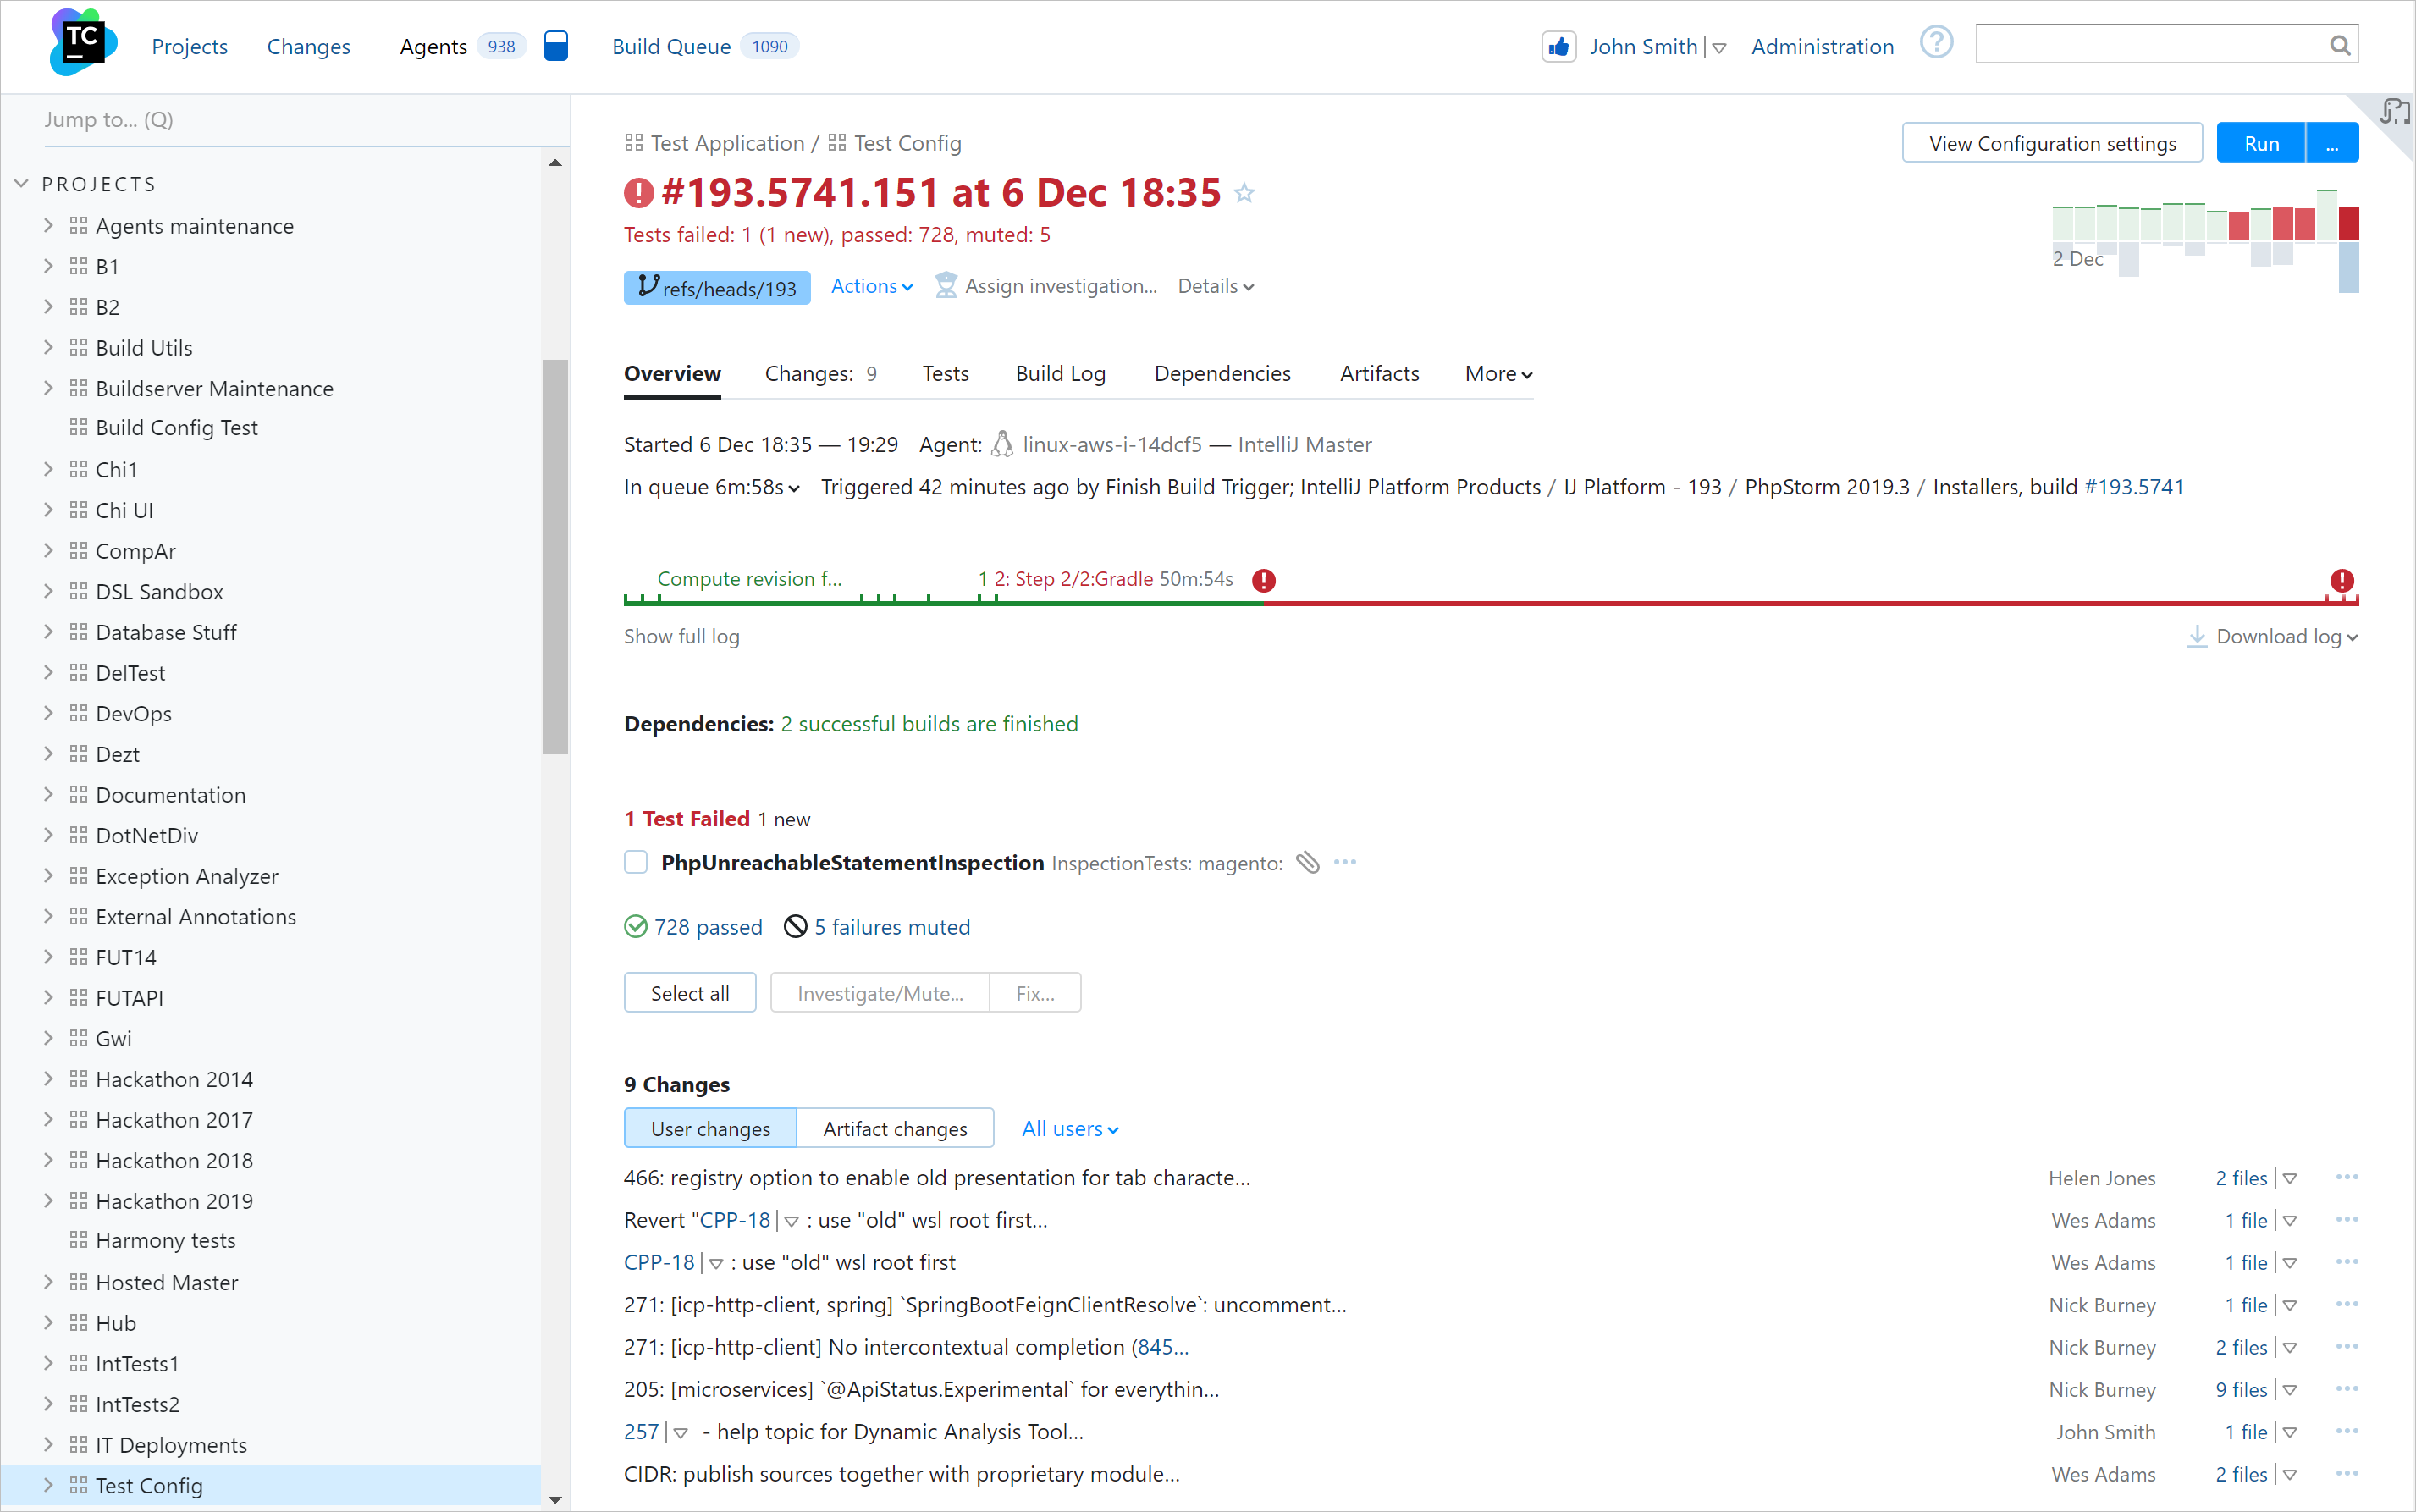
With the Trends block, you can instantly preview all the previous builds and their details, without leaving the current build page:

The graphic timeline reflects the duration of each build stage and indicates build problems:

Click any stage to open the corresponding line of the build log. In the new UI, even a long log can be displayed directly in the preview, with no need to download it.
tip
The Actions menu offers a handy new option — Compare with. Choose this action to compare the parameters and results of the current build with any other selected build side-by-side.
This option is also available from the build's context menu in the build list.
Apart from the Overview tab, you can use the revamped Changes, Tests, and Dependencies tabs:
The Changes tab displays more information about changes in the build, separately for user commits and artifact changes. You can filter changes by their author and display changes made in the build configuration settings.
The Tests tab allows switching between failed, ignored, and succeeded tests. Click a test to quickly view its details or, for example, to assign an investigation. You can also view its history on the new Test History page.
The Dependencies tab provides three alternative modes of displaying the build dependencies: a visual timeline, structured list, and build chain. Choose the mode that is the most helpful for your current task.
Other classic UI tabs are also available: click More and select the required tab in the list.
The experimental Agents page loads faster for a large number of agents and allows quickly switching between agent details.

The page provides a better hierarchical view of agent pools and makes it easier to see all their assigned projects and cloud images.
The All Agents view gives a quick preview of all agents' statuses and allows managing them side by side, on a single dashboard.
You can edit the scope of agent pools and quickly assign agents and projects to them.
To edit an agent pool, click Assign agents in its settings. In this dialog, you can choose what agents you want to assign to the pool:
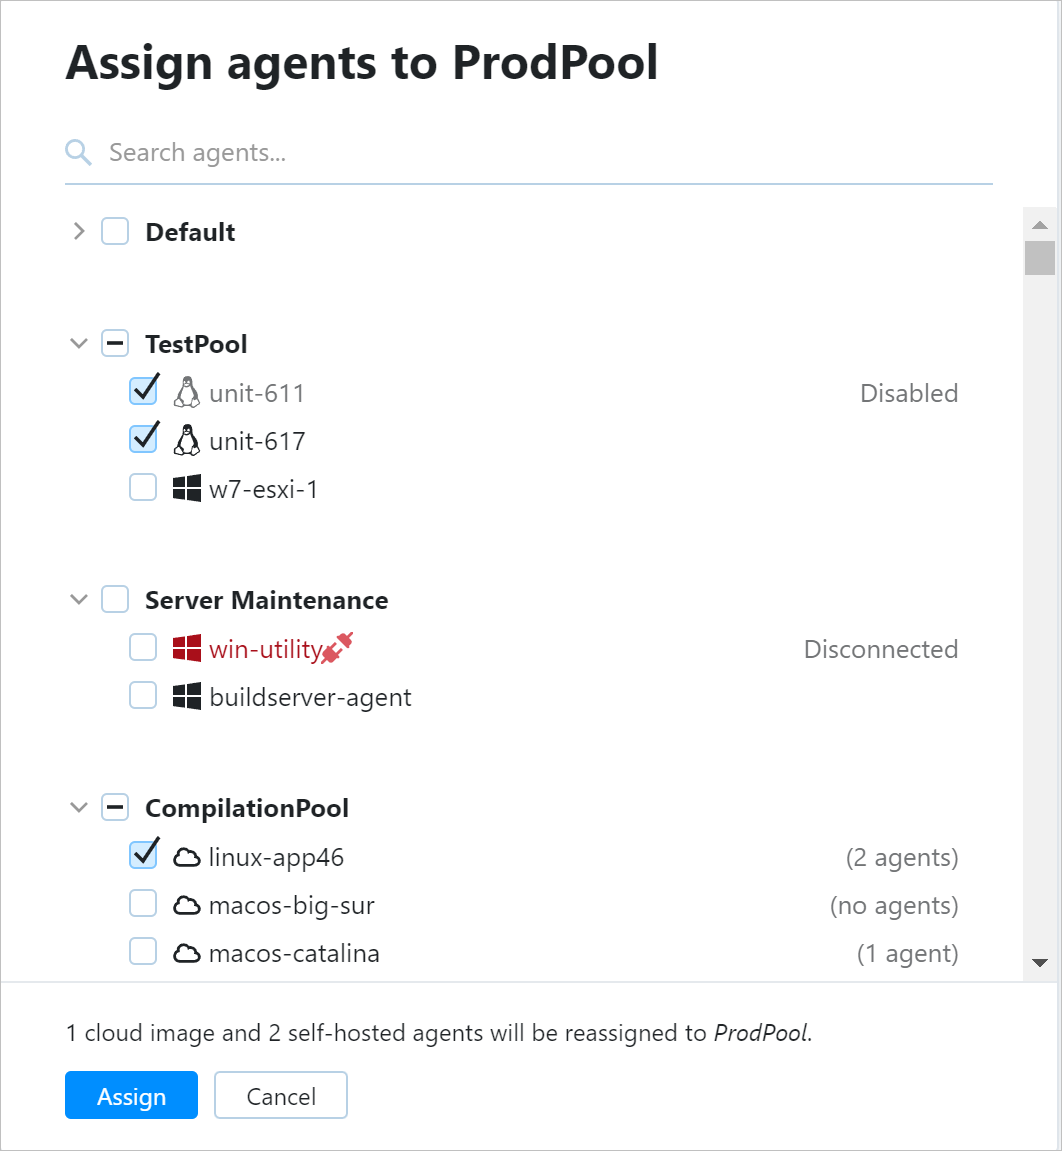
Note that whenever you select a cloud image, you actually assign all its instances to the pool. If this pool has a limit of agent slots, each cloud instance will take a single slot, just like any regular agent.
Similarly, you can also associate projects with this pool: open the Projects tab of the pool's settings and click Assign projects. This way, agents assigned to this pool will be allowed to run builds only in the selected projects.
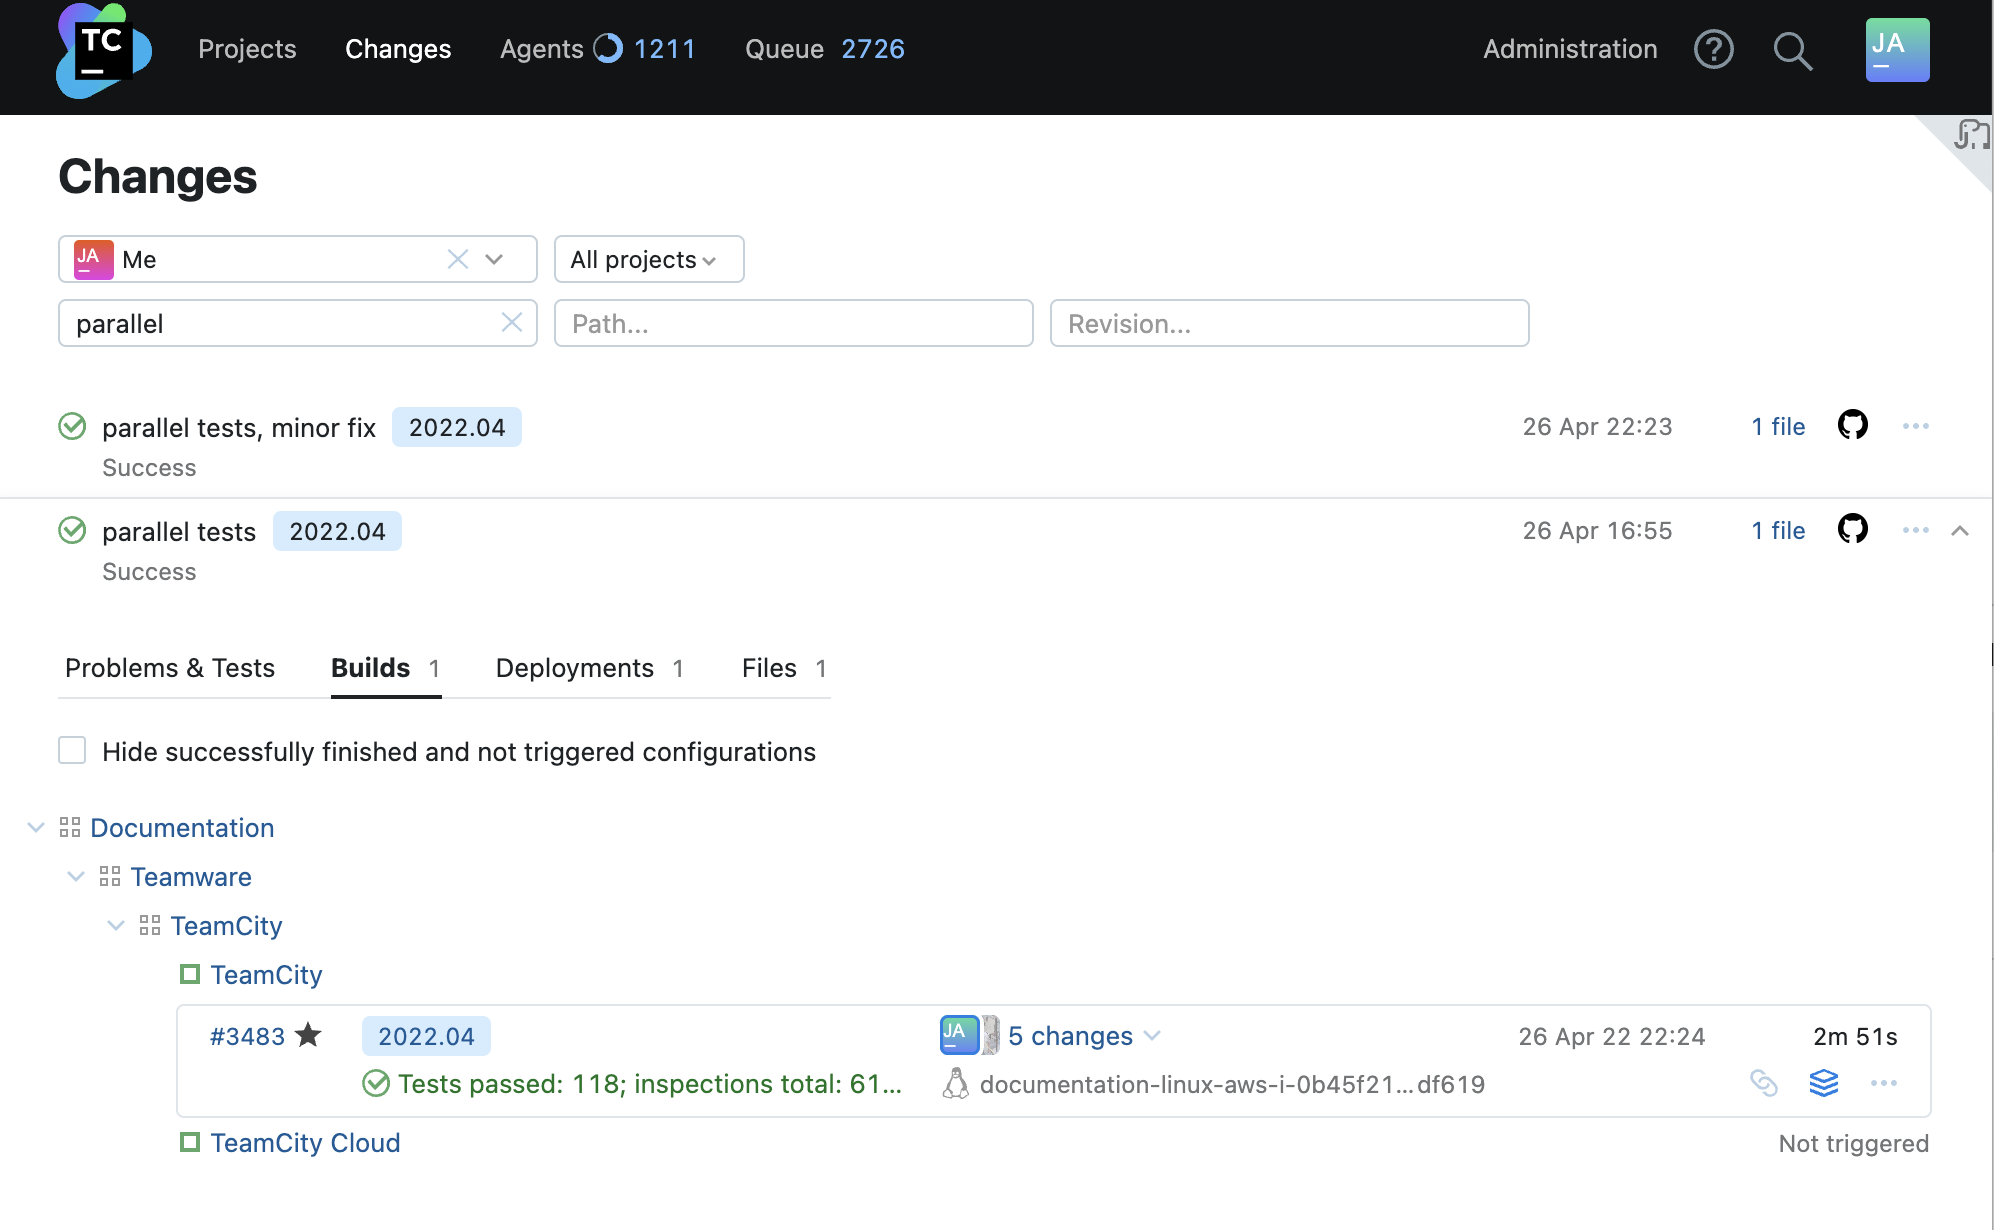
Since TeamCity 2020.04, the new Changes page is displayed by default. It comes with filters providing flexible search options allowing you to sort changes by comment (commit message), by path to the changed file, and by revision number.
Since TeamCity 2020.2.2, the new queue is displayed by default. In earlier versions, you can switch to it by clicking the test-tube icon in the upper right corner of the screen.
You can click any build in the queue to see its details:

The experimental sidebar is available for the project hierarchy and agent hierarchy. Depending on the current page, it serves for better navigation between either projects and build configurations, or build agents.
You can change the sidebar width by dragging its frame border and hide/show it anytime by clicking the corresponding button at its bottom.
To customize a sidebar, click ![]() in its upper-right corner. In the customization menu, you can move a project or build configuration in the list via a keyboard or using the arrow UI button, or mark/clear projects as favorite.
in its upper-right corner. In the customization menu, you can move a project or build configuration in the list via a keyboard or using the arrow UI button, or mark/clear projects as favorite.
The Projects sidebar lists all the projects available to the current user of TeamCity and allows searching them by name. You can expand any project to see its nested subprojects / build configurations and quickly switch between them. If a project is added to your Favorites, you will also see the status icons and counters for all its nested objects directly in the sidebar.
The sidebar allows accessing the Favorite projects and Favorite builds views with the lists of your favorite projects and favorite build configurations respectively.
You can also toggle the display of archived projects.
You can use the Q keyboard shortcut to focus on the projects' search field. When focused, use ↑ and ↓ keyboard arrows to navigate between search results. To remove the focus, press Esc.
The Agents sidebar allows browsing the agent pool hierarchy and searching agents and pools by name. The Overview view provides statistics about all the agents on the server.