Build Results Page
In TeamCity, all information about a build, whether it is queued, running or finished, is accumulated on its Build Results page. To view build results, choose any configuration to view its build history and click a required build number.
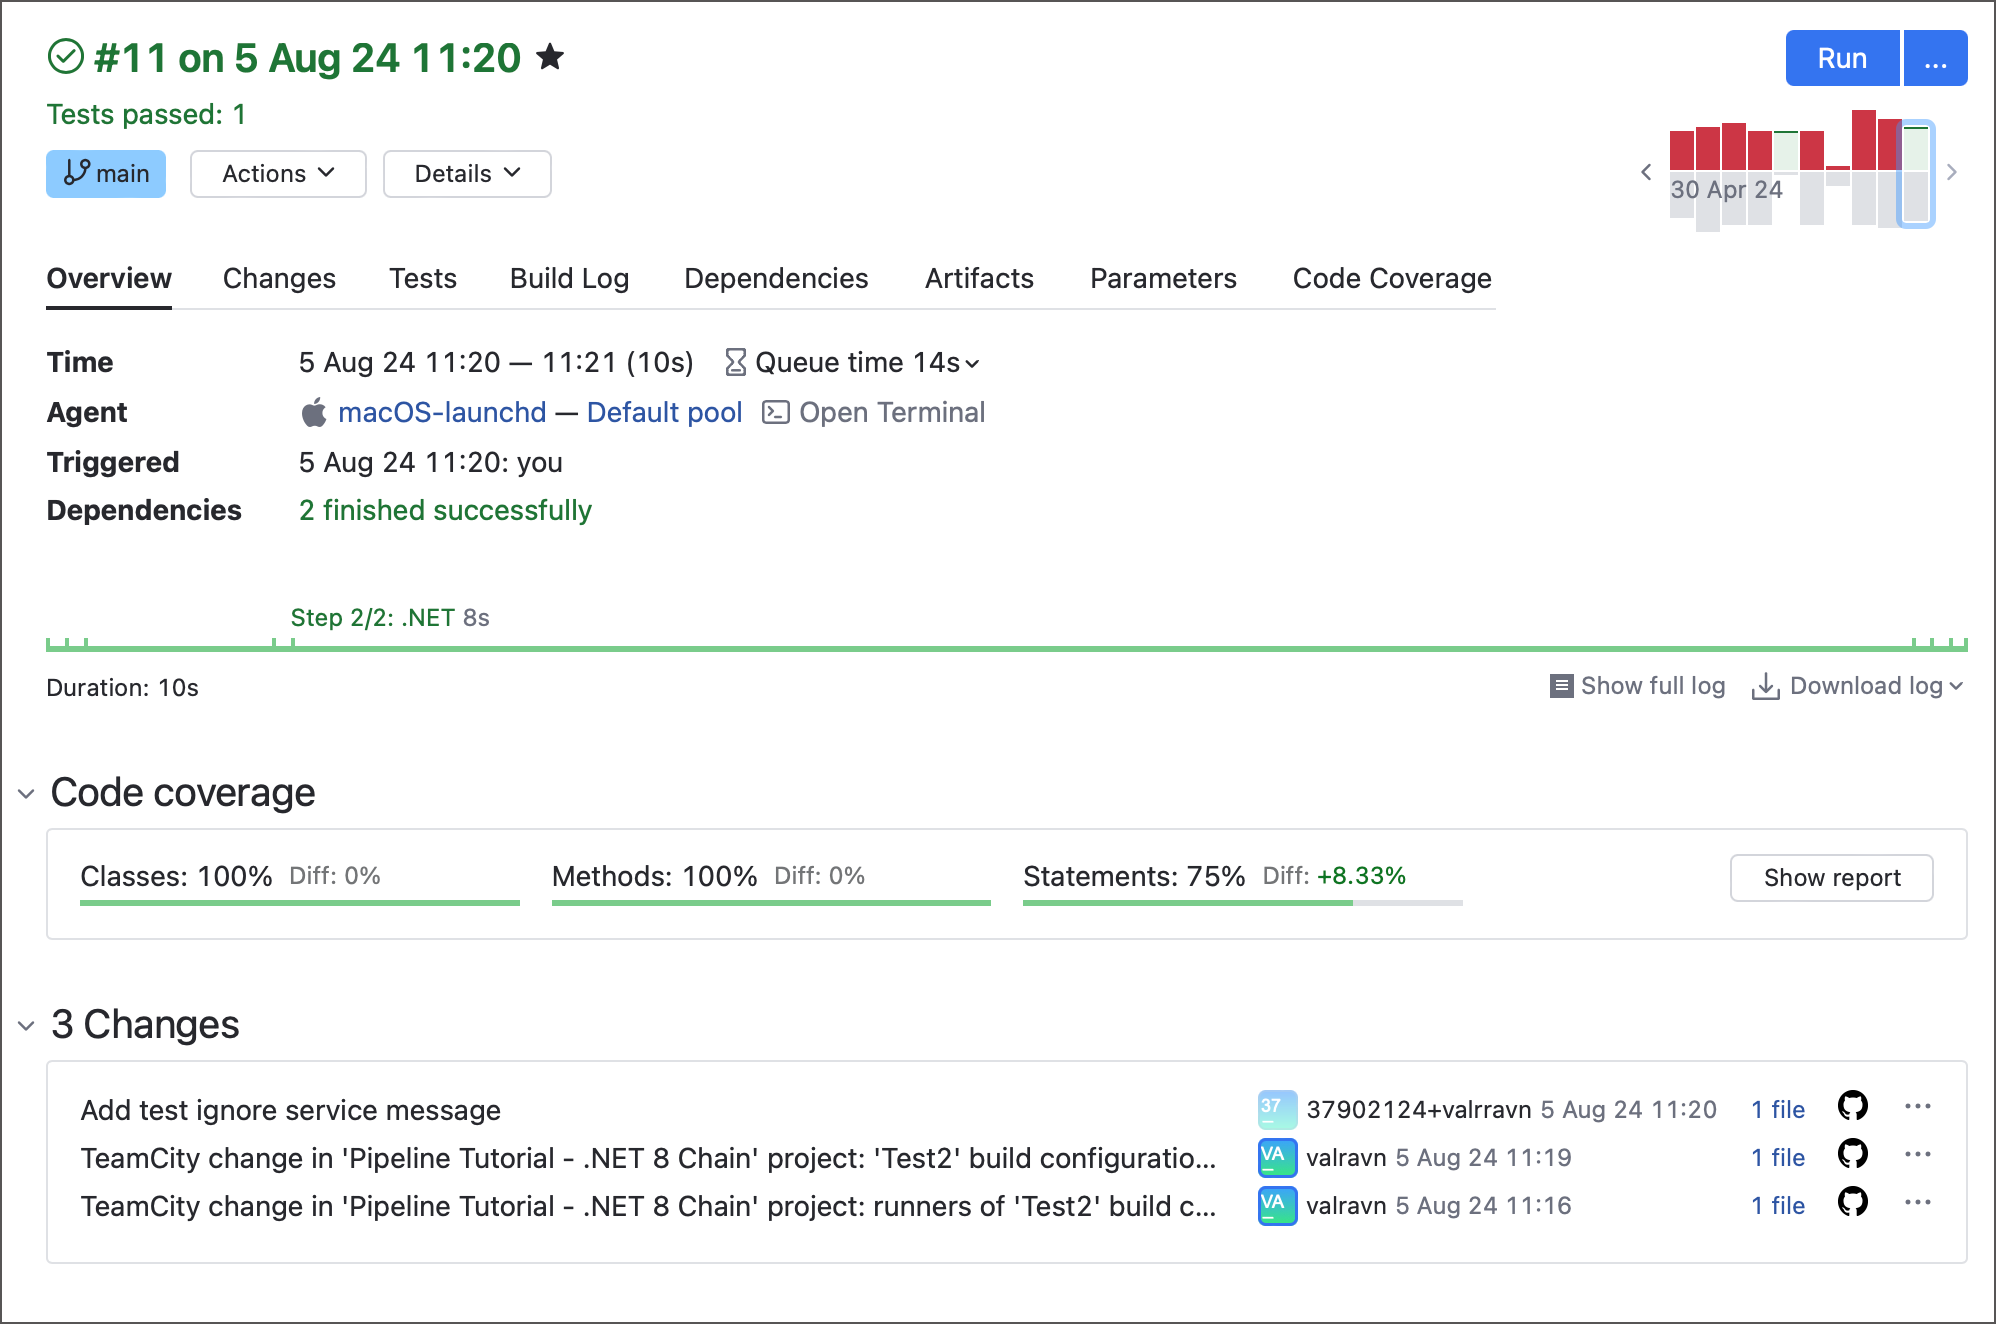
This page includes several static tabs (Overview, Changes, Build Log, Artifacts, and others), as well as contextual tabs whose visibility depends on specific configuration features. For example, the Dependencies tab is shown only for builds whose parent configurations belong to a build chain.
Internal Build ID
Knowing a build ID can be required when working with REST API or downloading build artifacts. You can obtain this ID from the URL or the Parameters tab of the Build Results page.
The URL of the Build Results page typically looks like the following:
In Sakura UI:
<SERVER_URL>/buildConfiguration/<CONFIGURATION_ID>/<BUILD_ID>?....In Classic UI:
<SERVER_URL>/viewLog.html?buildId=<BUILD_ID>&buildTypeId=<CONFIGURATION_ID>&...
The <BUILD_ID> portion is the internal numeric build ID uniquely identifying this build in TeamCity.
You can also find the same value under the build's Parameters tab in TeamCity UI, stored in the teamcity.build.id parameter.
Overview Tab
The Overview tab displays general information about the build: build duration, user or automatic trigger that started it, a build agent that was used to run it, the summary of processed changes, and so on.
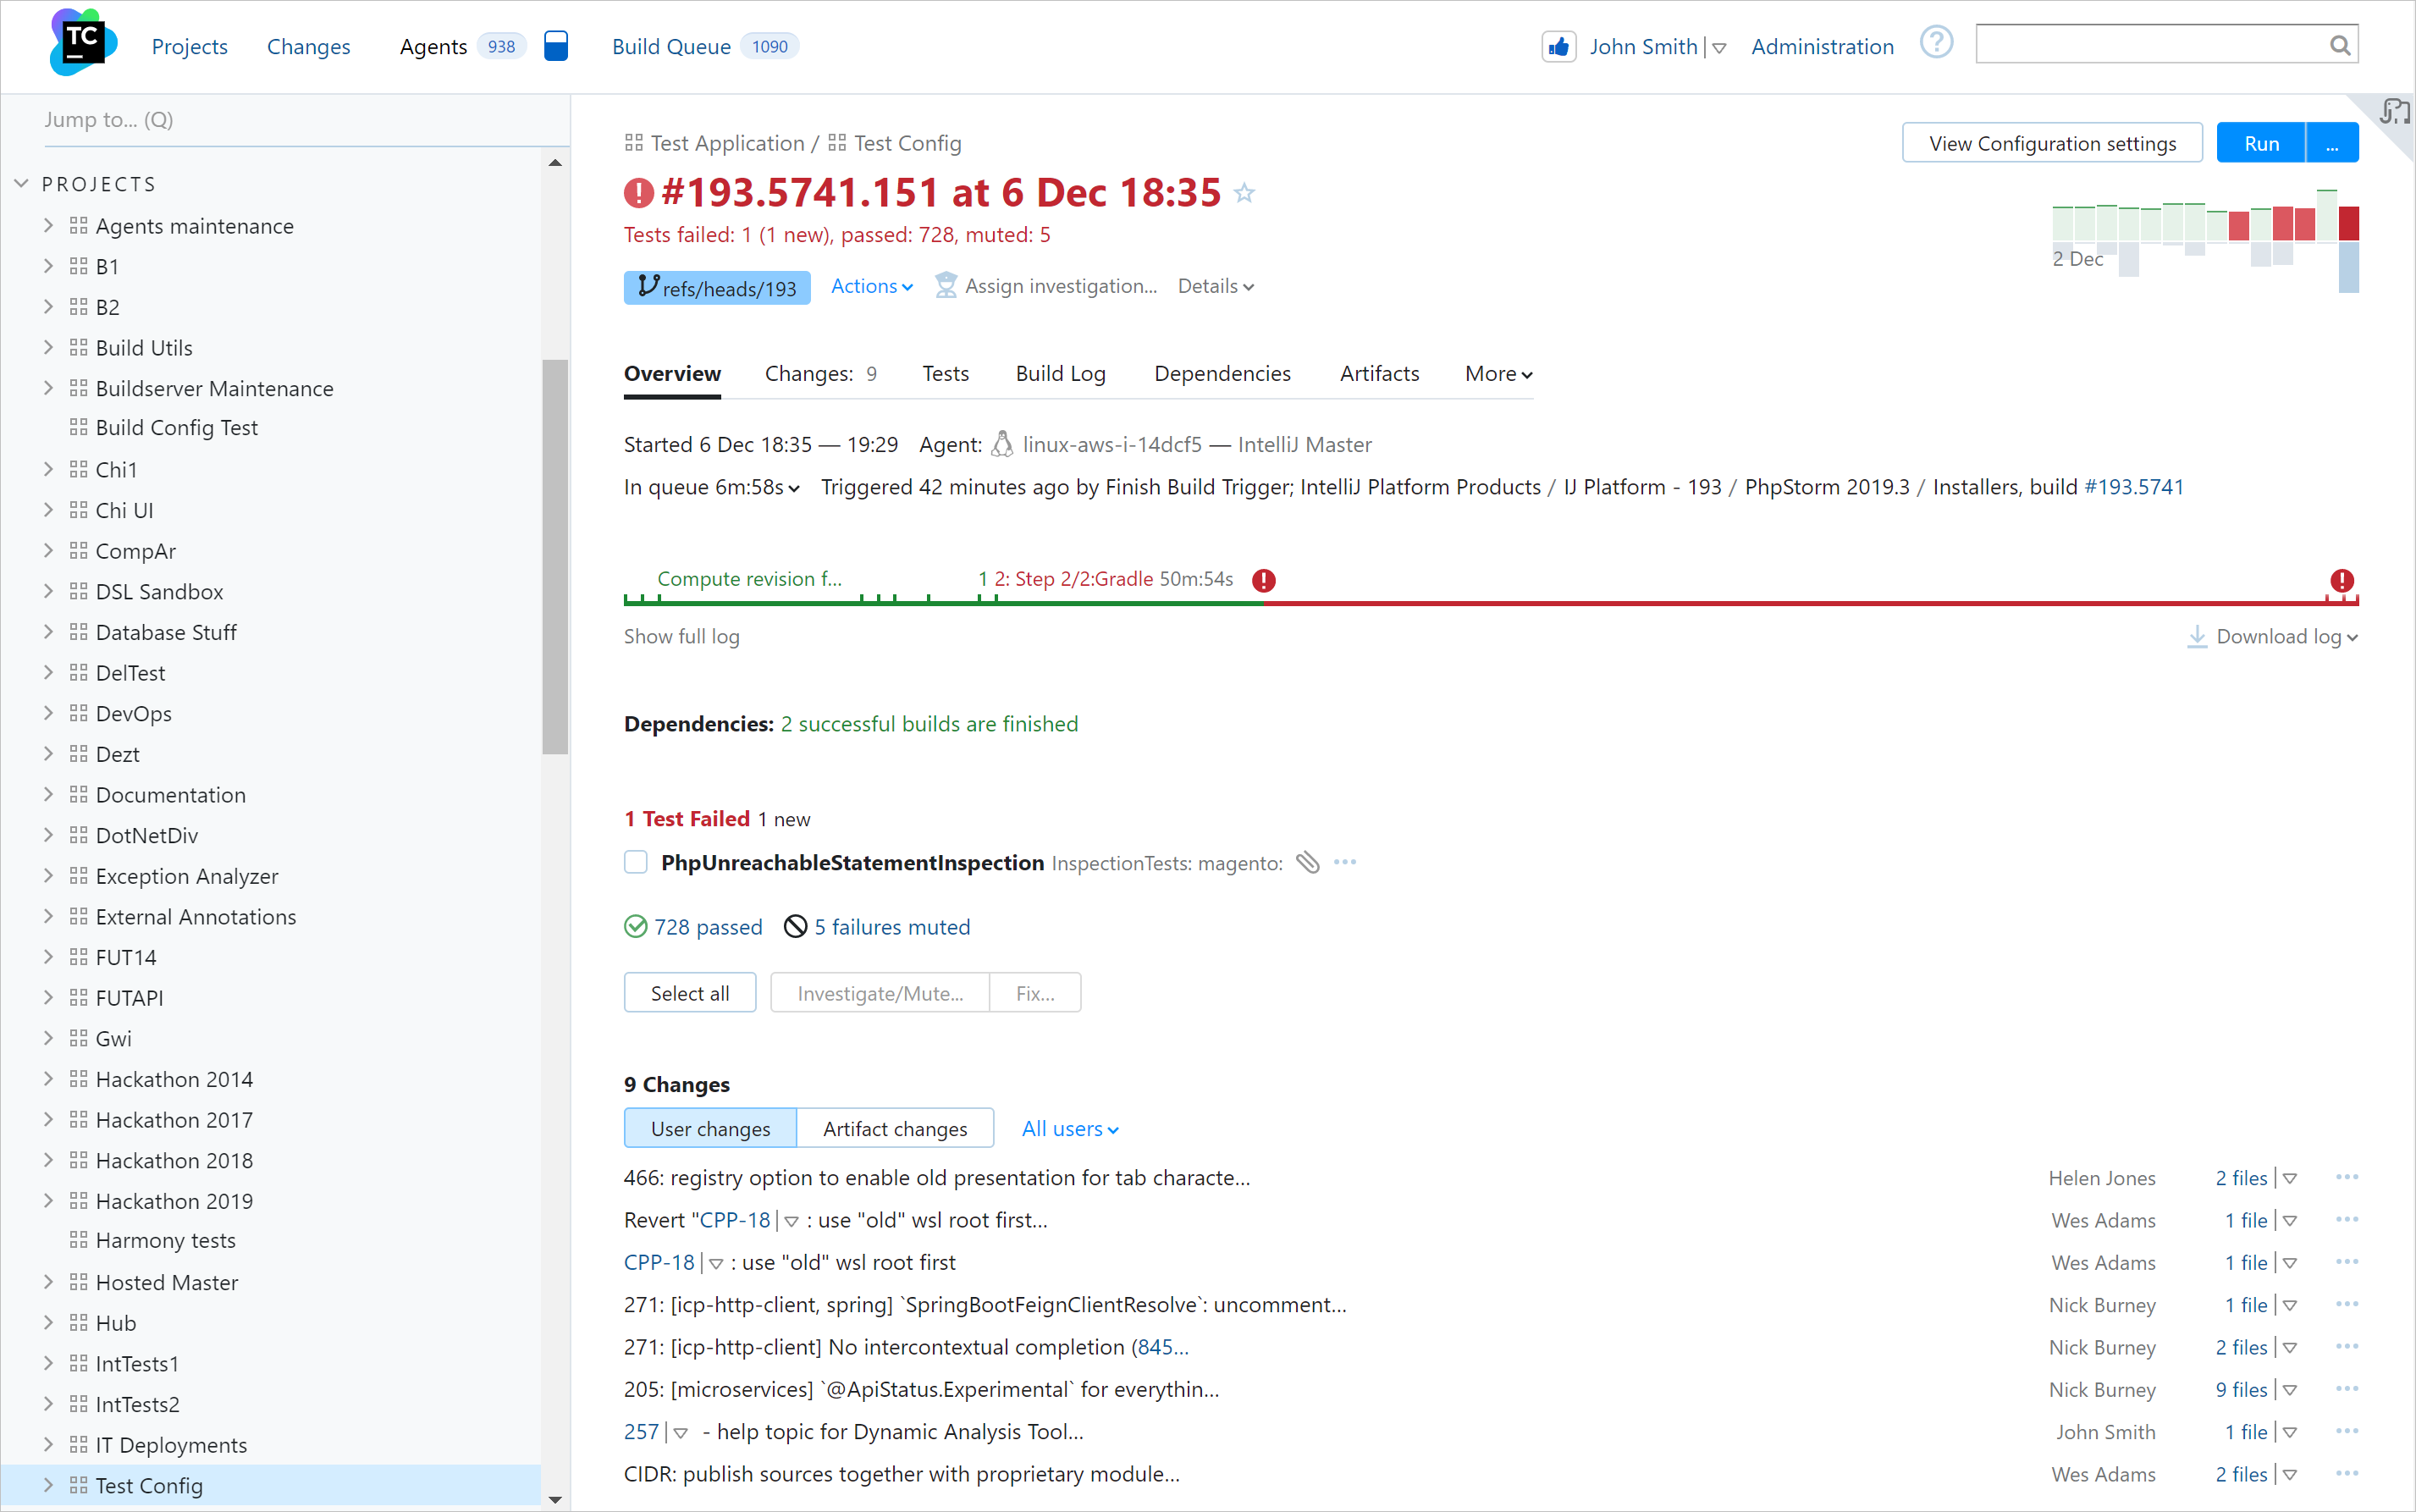
It also shows the diagnostic messages related to the current build's status.
Changes Tab
The Changes tab shows the code changes associated with the build, including commit messages and authors. This tab allows you to:
Filter changes by their author, comment, path, and revision.
Review all changes included in the build with their corresponding revisions in version control.
View changes from related dependencies (for builds that belong to a build chain).
If the current build configuration has an artifact dependency, and the artifact downloaded in the current build has changed compared to the one downloaded in the previous build of the current configuration, the Artifact dependencies changes node appears displaying the build which was used to download artifact dependencies from, and the changes which were included in that build.
View file changes as diffs: tick the Show files checkbox and click a modified file.
Download a change as a .patch diff file: click the ellipsis button (...) and select Download patch.
Trigger a custom build with this change.
Review the change in an external change viewer, if configured by the administrator.
If enabled, the Show graph checkbox displays the changes as a graph of commits to the VCS roots related to this build. Key features of this graph include:
Hover over to a graph node to view the VCS root revision number, and a connector line between nodes to view VCS roots that were changed in this build. Each of the roots is displayed as a separate line. You can click any bar to highlight changes pertaining to this root.
If there have been merges between the branches of the repository, the graph displays them.
If your VCS root has subrepositories (marked S in the list of changes), navigate to a node in the parent to see which commits in subrepositories are referenced by this revision in the parent.
Build Log Tab
The graphic build log timeline reflects the duration of each build stage and indicates build problems:

Click any stage to open the corresponding line of the build log.
More information on build logs in TeamCity is available here.
Artifacts Tab
Provides access to downloadable files produced by the build (executables, images, documentation, and so on).
Parameters Tab
The Parameters tab allows you to track standard and user-defined build parameters associated with this build. Highlights parameters whose values changed during the build.
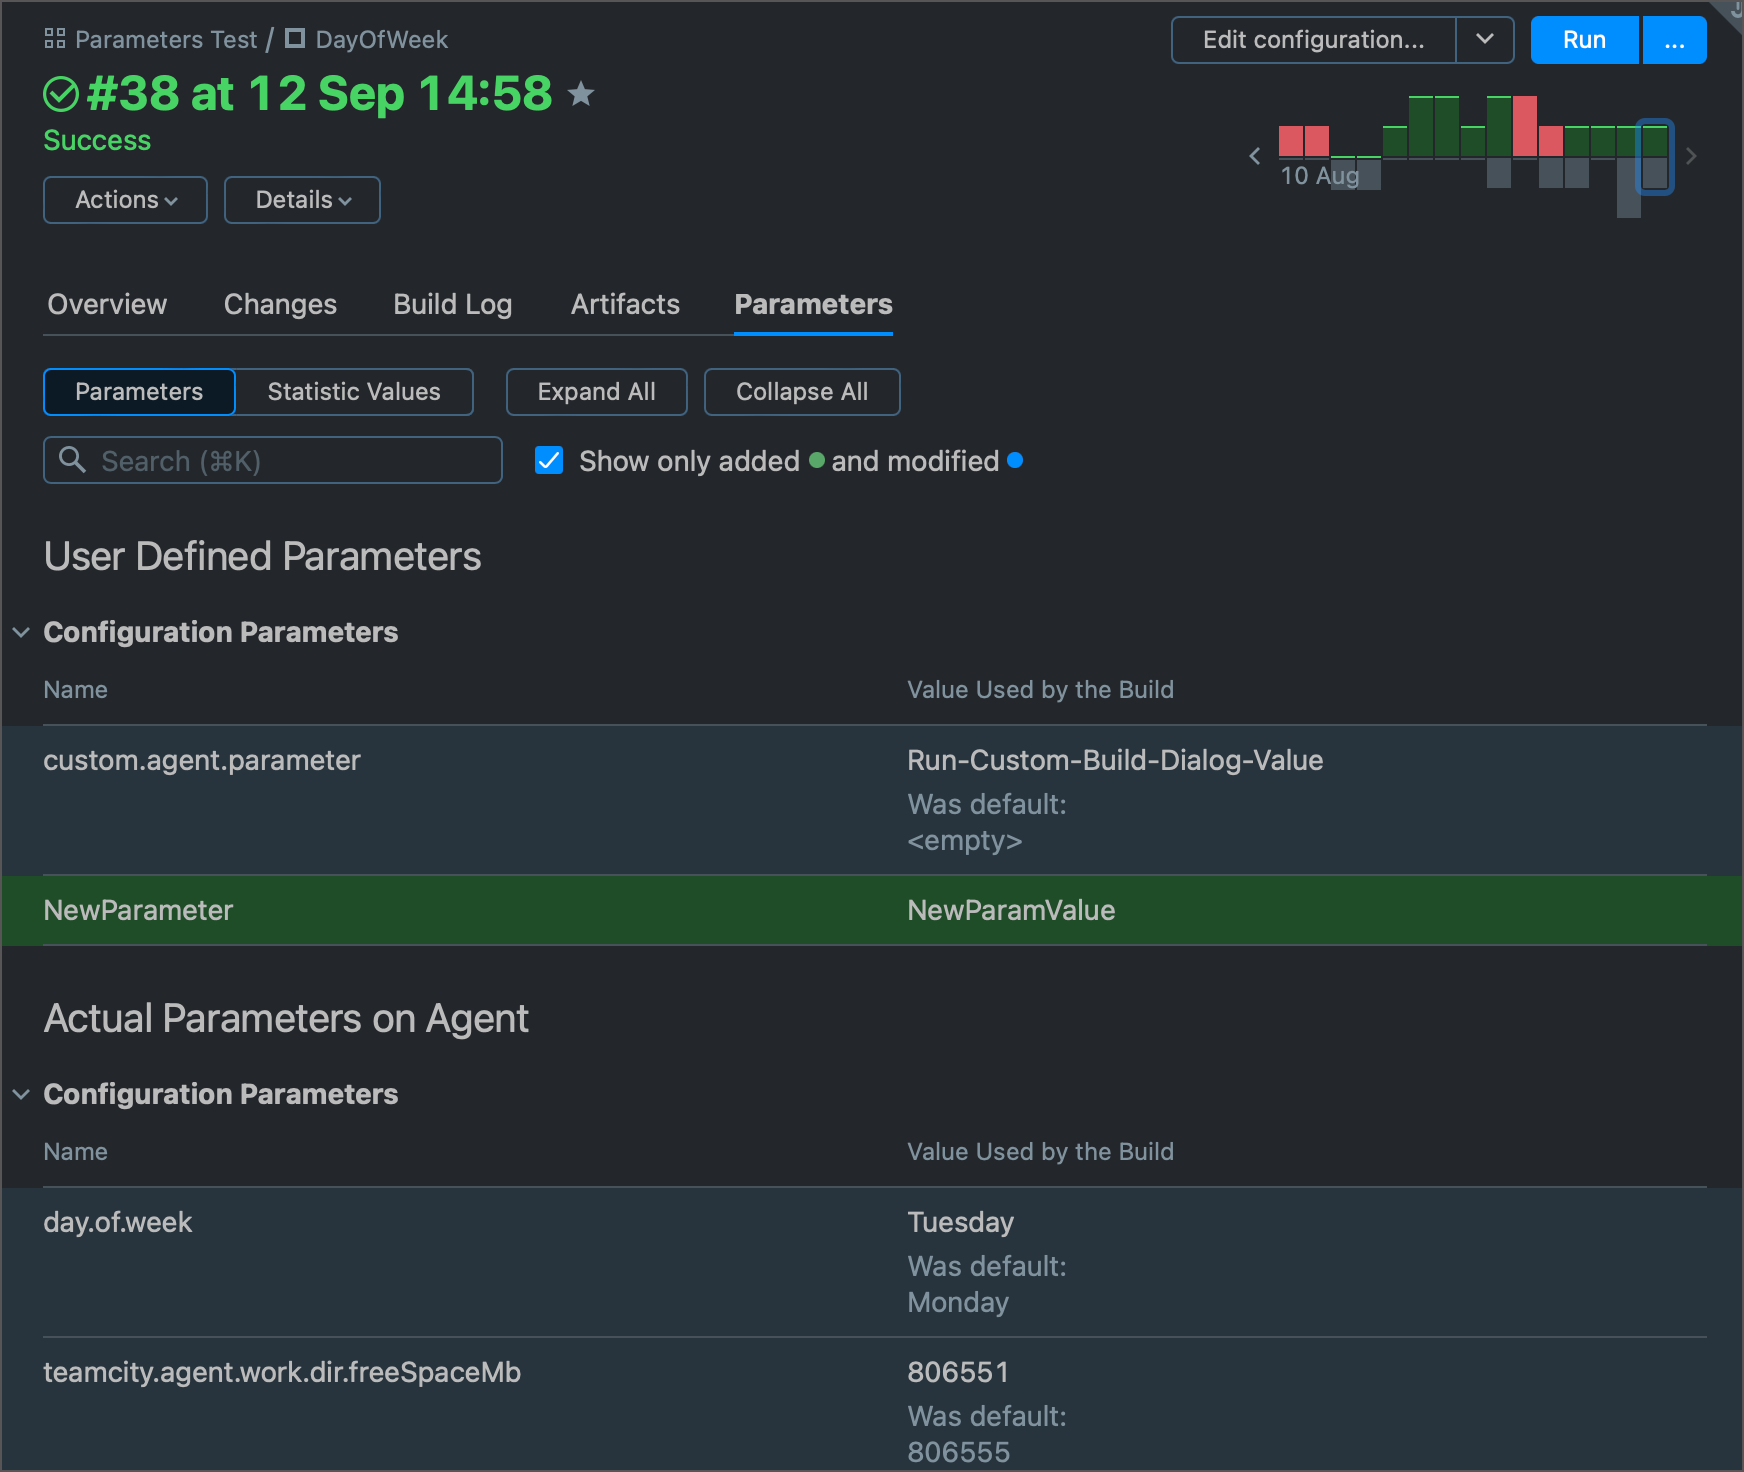
This page has two tabs:
Parameters — lists values for all configuration parameters, system properties, and environment variables. You can tick a related checkbox to view only those parameters that changed their values during this build.
Statistic values — lists all statistics values reported for the build (for example, build success rate or time required to check out a remote repository). The View Chart button (
 ) allows you to check how these values trend throughout build runs.
Dependencies Tab
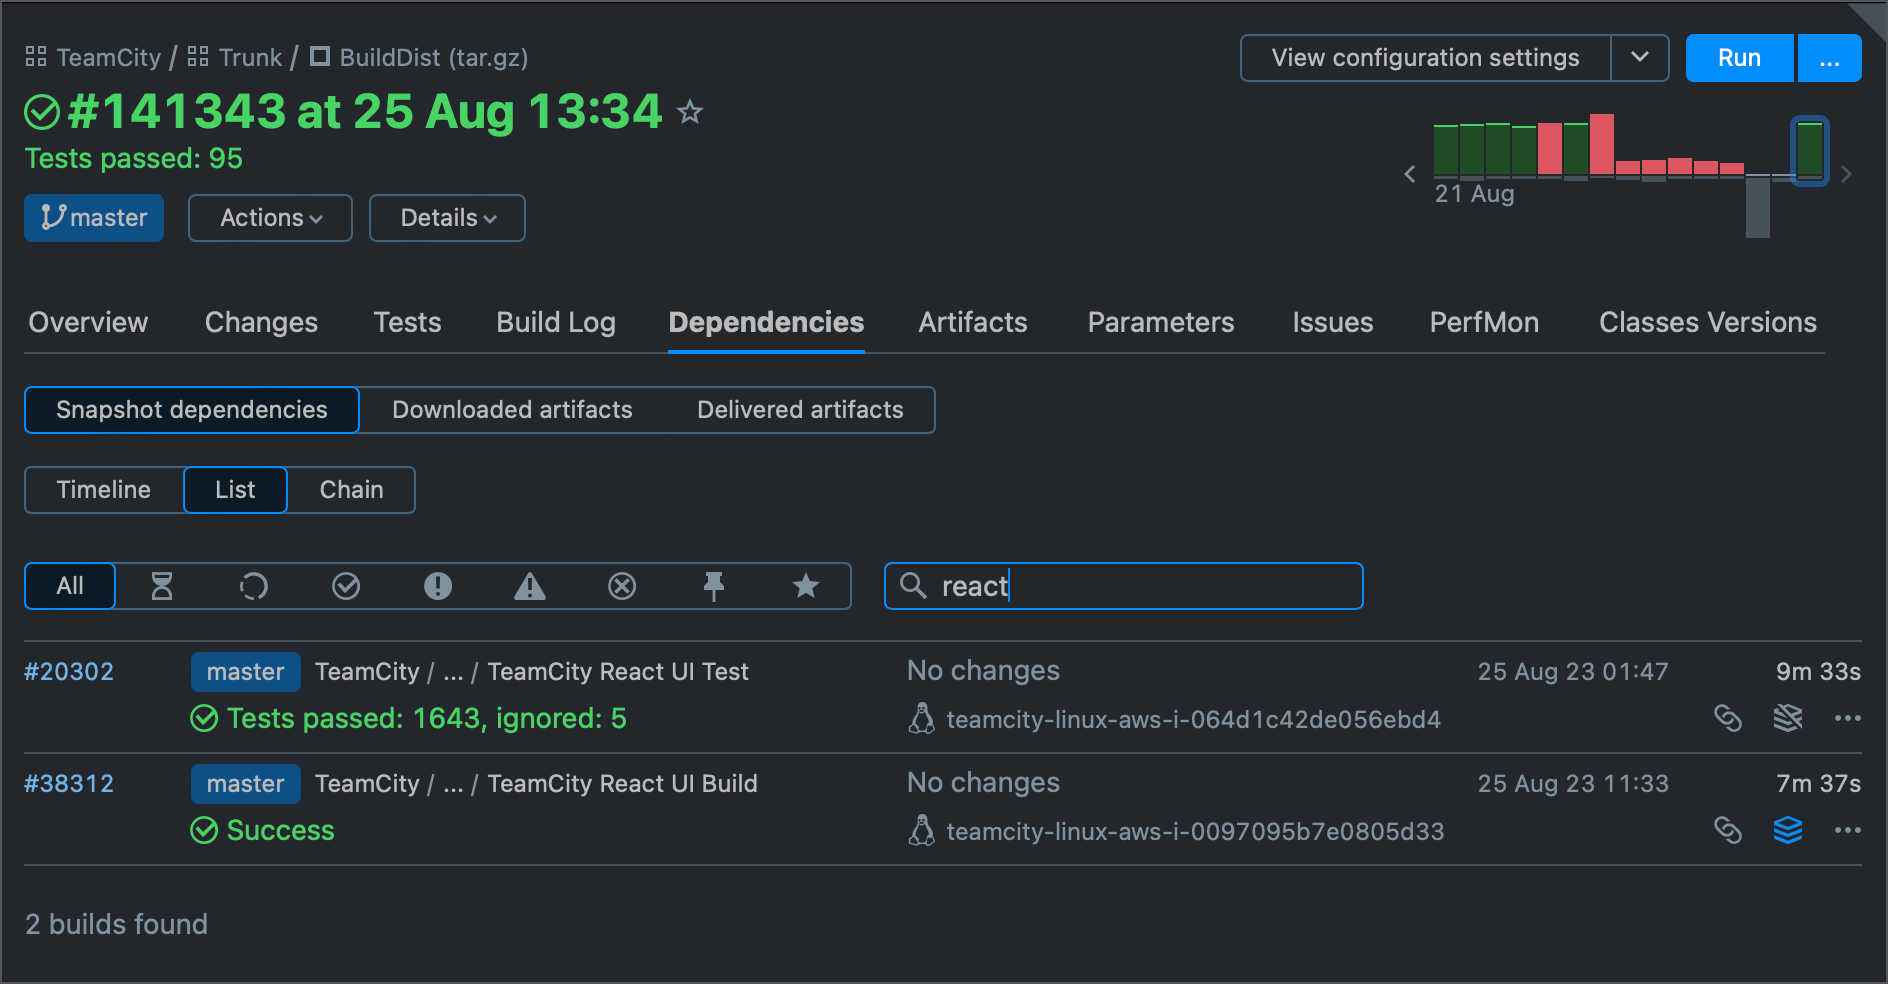
If a finished build has artifact and/or snapshot dependencies, the Dependencies tab is displayed on the Build Results page. Here you can explore builds whose artifacts and/or sources were used for creating this build (downloaded artifacts) as well as the builds which used the artifacts and/or sources of the current build (delivered artifacts). Additionally, you can view indirect dependencies for the build. That is, for example, if build A depends on build B which depends on builds C and D, then these builds C and D are indirect dependencies for build A.
The Dependencies tab provides three modes of displaying the build dependencies: a visual timeline, structured list, and build chain. Choose the mode that is the most helpful for your current task.
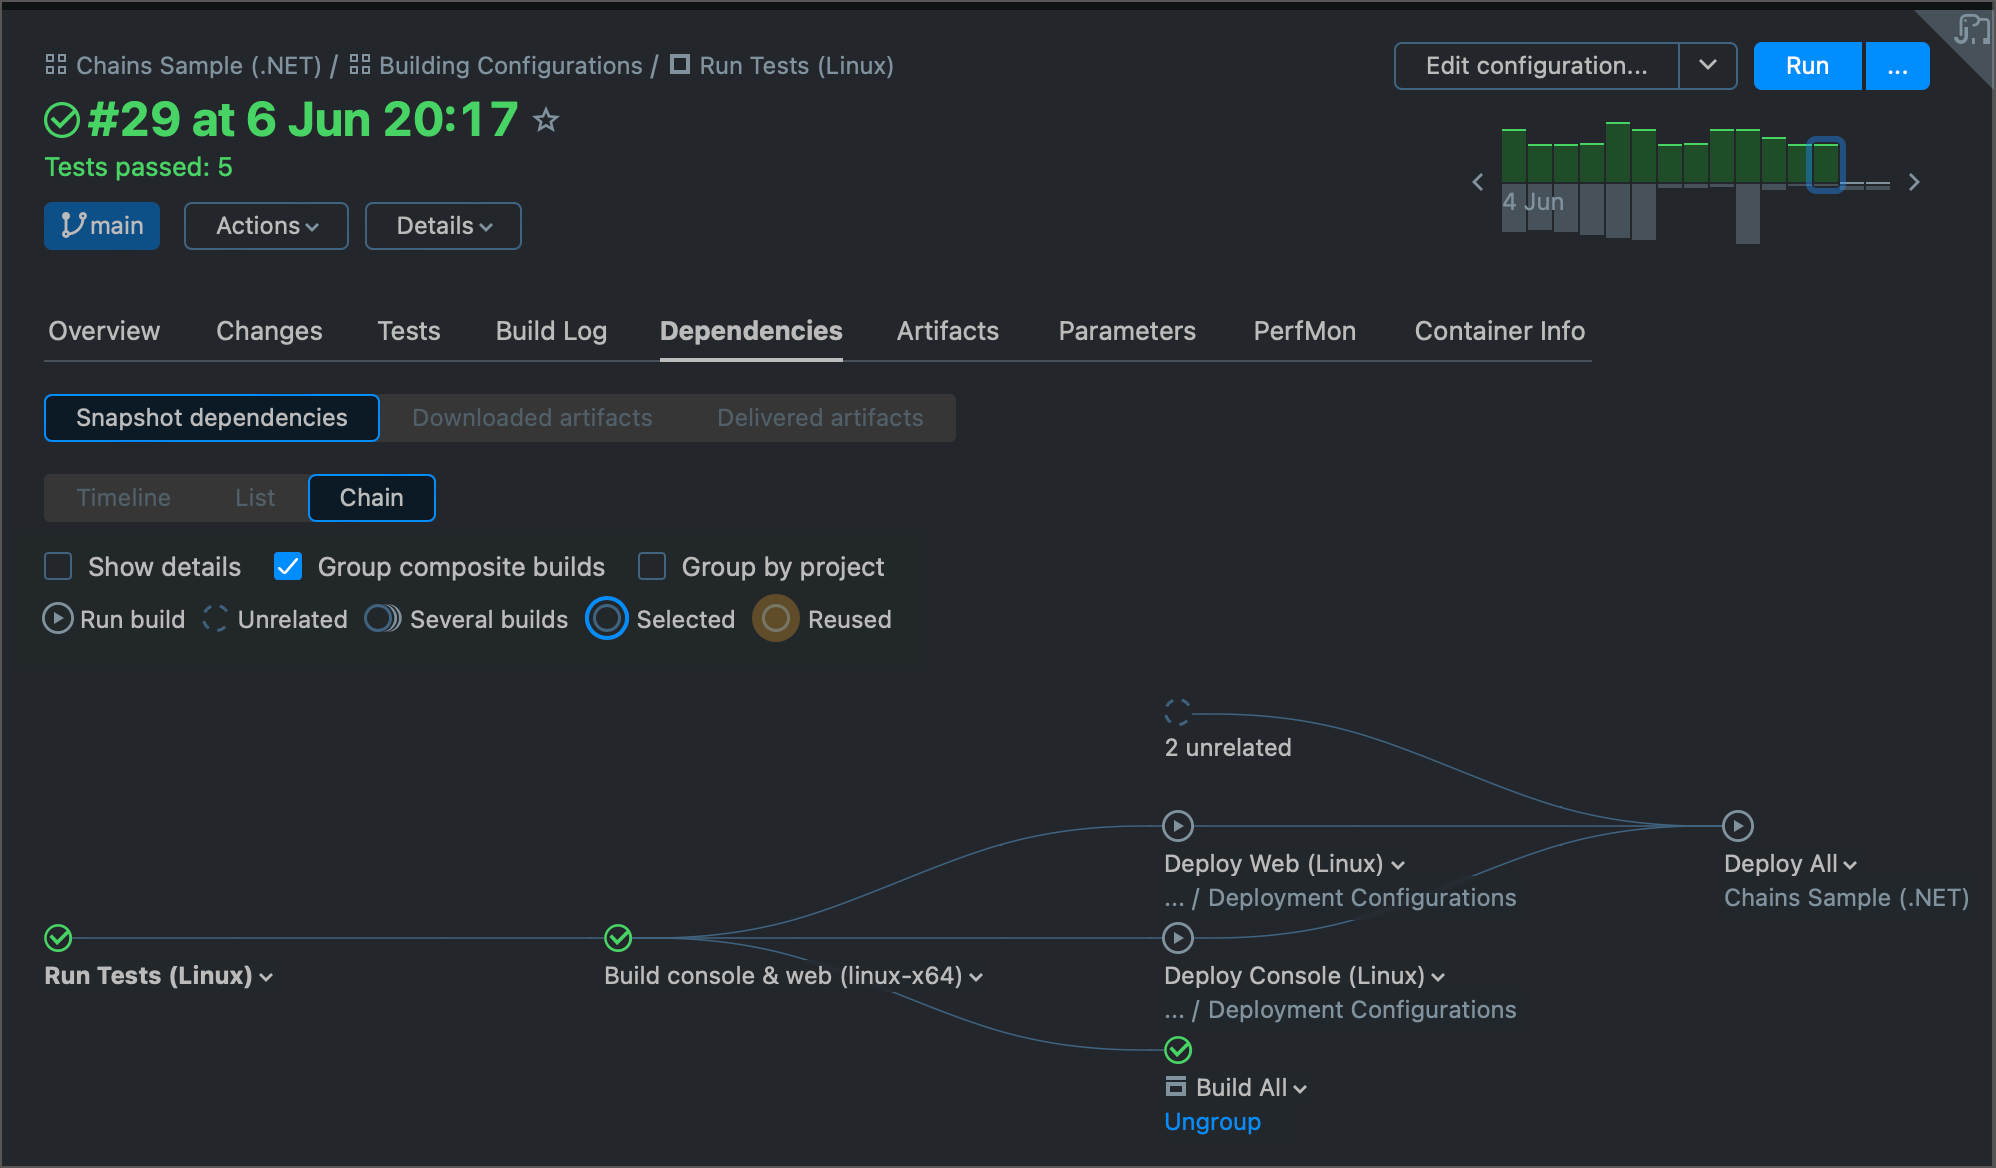
The "Timeline" and "List" view modes allow you to search for specific builds by their names.
Issues Tab
If a build configuration has a integration with an issue tracker set up and if there is at least one issue mentioned in the comments for the included changes or in the comments for the build itself, you will see the list of issues related to the current build in the Issues tab.
Code Coverage Tab
If you have code coverage configured in your build runner, the Code Coverage tab with the full HTML code coverage report will appear.
By clicking the links in the Coverage Breakdown section, you can drill down to display statistics for different scopes: for example, Namespace, Assembly, Method, and Source Code.
Code Inspection Tab
If configured, the results of a Code Inspection build step are shown on the Code Inspection tab. Use the left pane to navigate through the inspection results; the filtered inspections are shown in the right pane.
Switch from the Total to Errors option, if you are not interested in warnings.
Use the scope filter to limit the view to the specific directories. This makes it easier for developers to manage specific code of interest.
Use the inspections tree view under the scope filter to display results by specific inspection.
Note that TeamCity displays the source code line number that contains the problem. Click it to jump the code in your IDE.
Duplicates Tab
If your build configuration has Duplicates build runner as one of the build steps, you will see the Duplicates tab in the Build Results.
The tab consists of:
A list of duplicates found. The new only option enables you to show only the duplicates that appeared in the latest build.
A list of files containing these duplicates. Use the left and right arrow buttons to show selected duplicate in the respective pane in the lower part of the tab.
Two panes with the source code of the file fragments that contain duplicates.
Scope filter in the upper-left corner lists the specific directories that contain the duplicates. This filtering makes it easier for developers to manage the code of interest.
Tests Tab
The Tests tab allows switching between failed, ignored, and succeeded tests, and use various filters.
For each failed test, you can view its stacktrace, the diff between the expected and actual values, jump to the test history, assign a team member to investigate its failure, open the test in your IDE and/or start fixing it right away.
To see a detailed test or investigation history, click Show test history or Show investigation history in its context menu.
Clicking the Show test history link opens the Test details page where you can find following information:
The test details, including the test success rate and test's run duration data and graph.
A complete test history table containing information about the test's status, its duration, and information on the builds this test was run in.
Test Duration Graph
The Test Duration graph is useful for comparing the amount of time it takes individual tests to run on the builds of this build configuration.
Test duration results are only available for the builds which are currently in the build history. Once a build has been cleaned up, this data is no longer available.
You can perform the following actions on the Test Duration Graph:
Filter out the builds that failed the test by clearing the Show failed option.
Calculate the daily average values by selecting the Average option.
Click a dot plotted on the graph to jump to the page with the results of the corresponding build.
View a build summary in the tooltip of a dot on the graph and navigate to the corresponding Build Results page.
Filter information by agents selecting or clearing a particular agent or by clicking All or None links to select or clear all agents.
Maven Build Info Tab
For each Maven build, a build agent gathers Maven-specific build details to be displayed on the Maven Build Info tab after the build finish. This tab can be useful for build engineers when adjusting build configurations.
PerfMon Tab
Shows hardware data related to this build: CPU usage statistics, memory consumption, and others. This page is available for build configuration with the Performance Monitor feature (included by default for all new configurations created via existing VCS connections).
Classic UI Tabs
Other classic UI tabs, not yet reproduced in the new UI, are also available: click More and select the required tab in the list. To view the sections described below, yu can also temporarily switch to the classic UI via the respective toggle in the upper right corner.
Build History in Classic UI
Build history is a record of the past builds produced by TeamCity. It is displayed as the Trends widget in the new UI and as the menu with links in the classic UI, which is described below.
To view the history of builds in the current configuration, click previous and next links in the upper right corner of Build Results. Click All history link to open the History tab.
Navigation menu:
![]()
The History tab:

Tests History in Classic UI
The Tests tab of the classic UI differs from the new version and contains a few unique features, such as the ability to download all tests in CSV and pop-up duration graph images. You can temporarily switch to it whenever you need its capabilities.