TeamCity Sakura UI
tip
The Sakura UI is now the default UI for new TeamCity users.
The Sakura UI, first introduced in TeamCity 2019.1 as an alternative to the classic UI, is now the default TeamCity UI. While the classic UI is still available and is maintained, the new product features will be supported in the Sakura UI only.
We recommend that you use the Sakura UI and benefit from a fresh, modern interface created with accessibility in mind. This new UI is actively developed, and your feedback is welcome.
When you sign in to TeamCity for the first time, the Sakura UI is enabled by default.
If you were using the classic UI, after upgrading TeamCity will offer you to switch to the Sakura UI and will remember your choice.
You can change the default UI in Your Profile | UI settings via the Use Sakura UI checkbox.
All pages supporting the new UI have a toggle to quickly access the classic UI: ![]() .
.
To return to the Sakura UI, click the magic wand icon: ![]() .
.
The section below provides an overview of the differences between the Sakura UI and the classic TeamCity UI.
The new UI comes with a handy sidebar that serves for quick navigation.
Currently, the Sakura UI is available for the following pages:
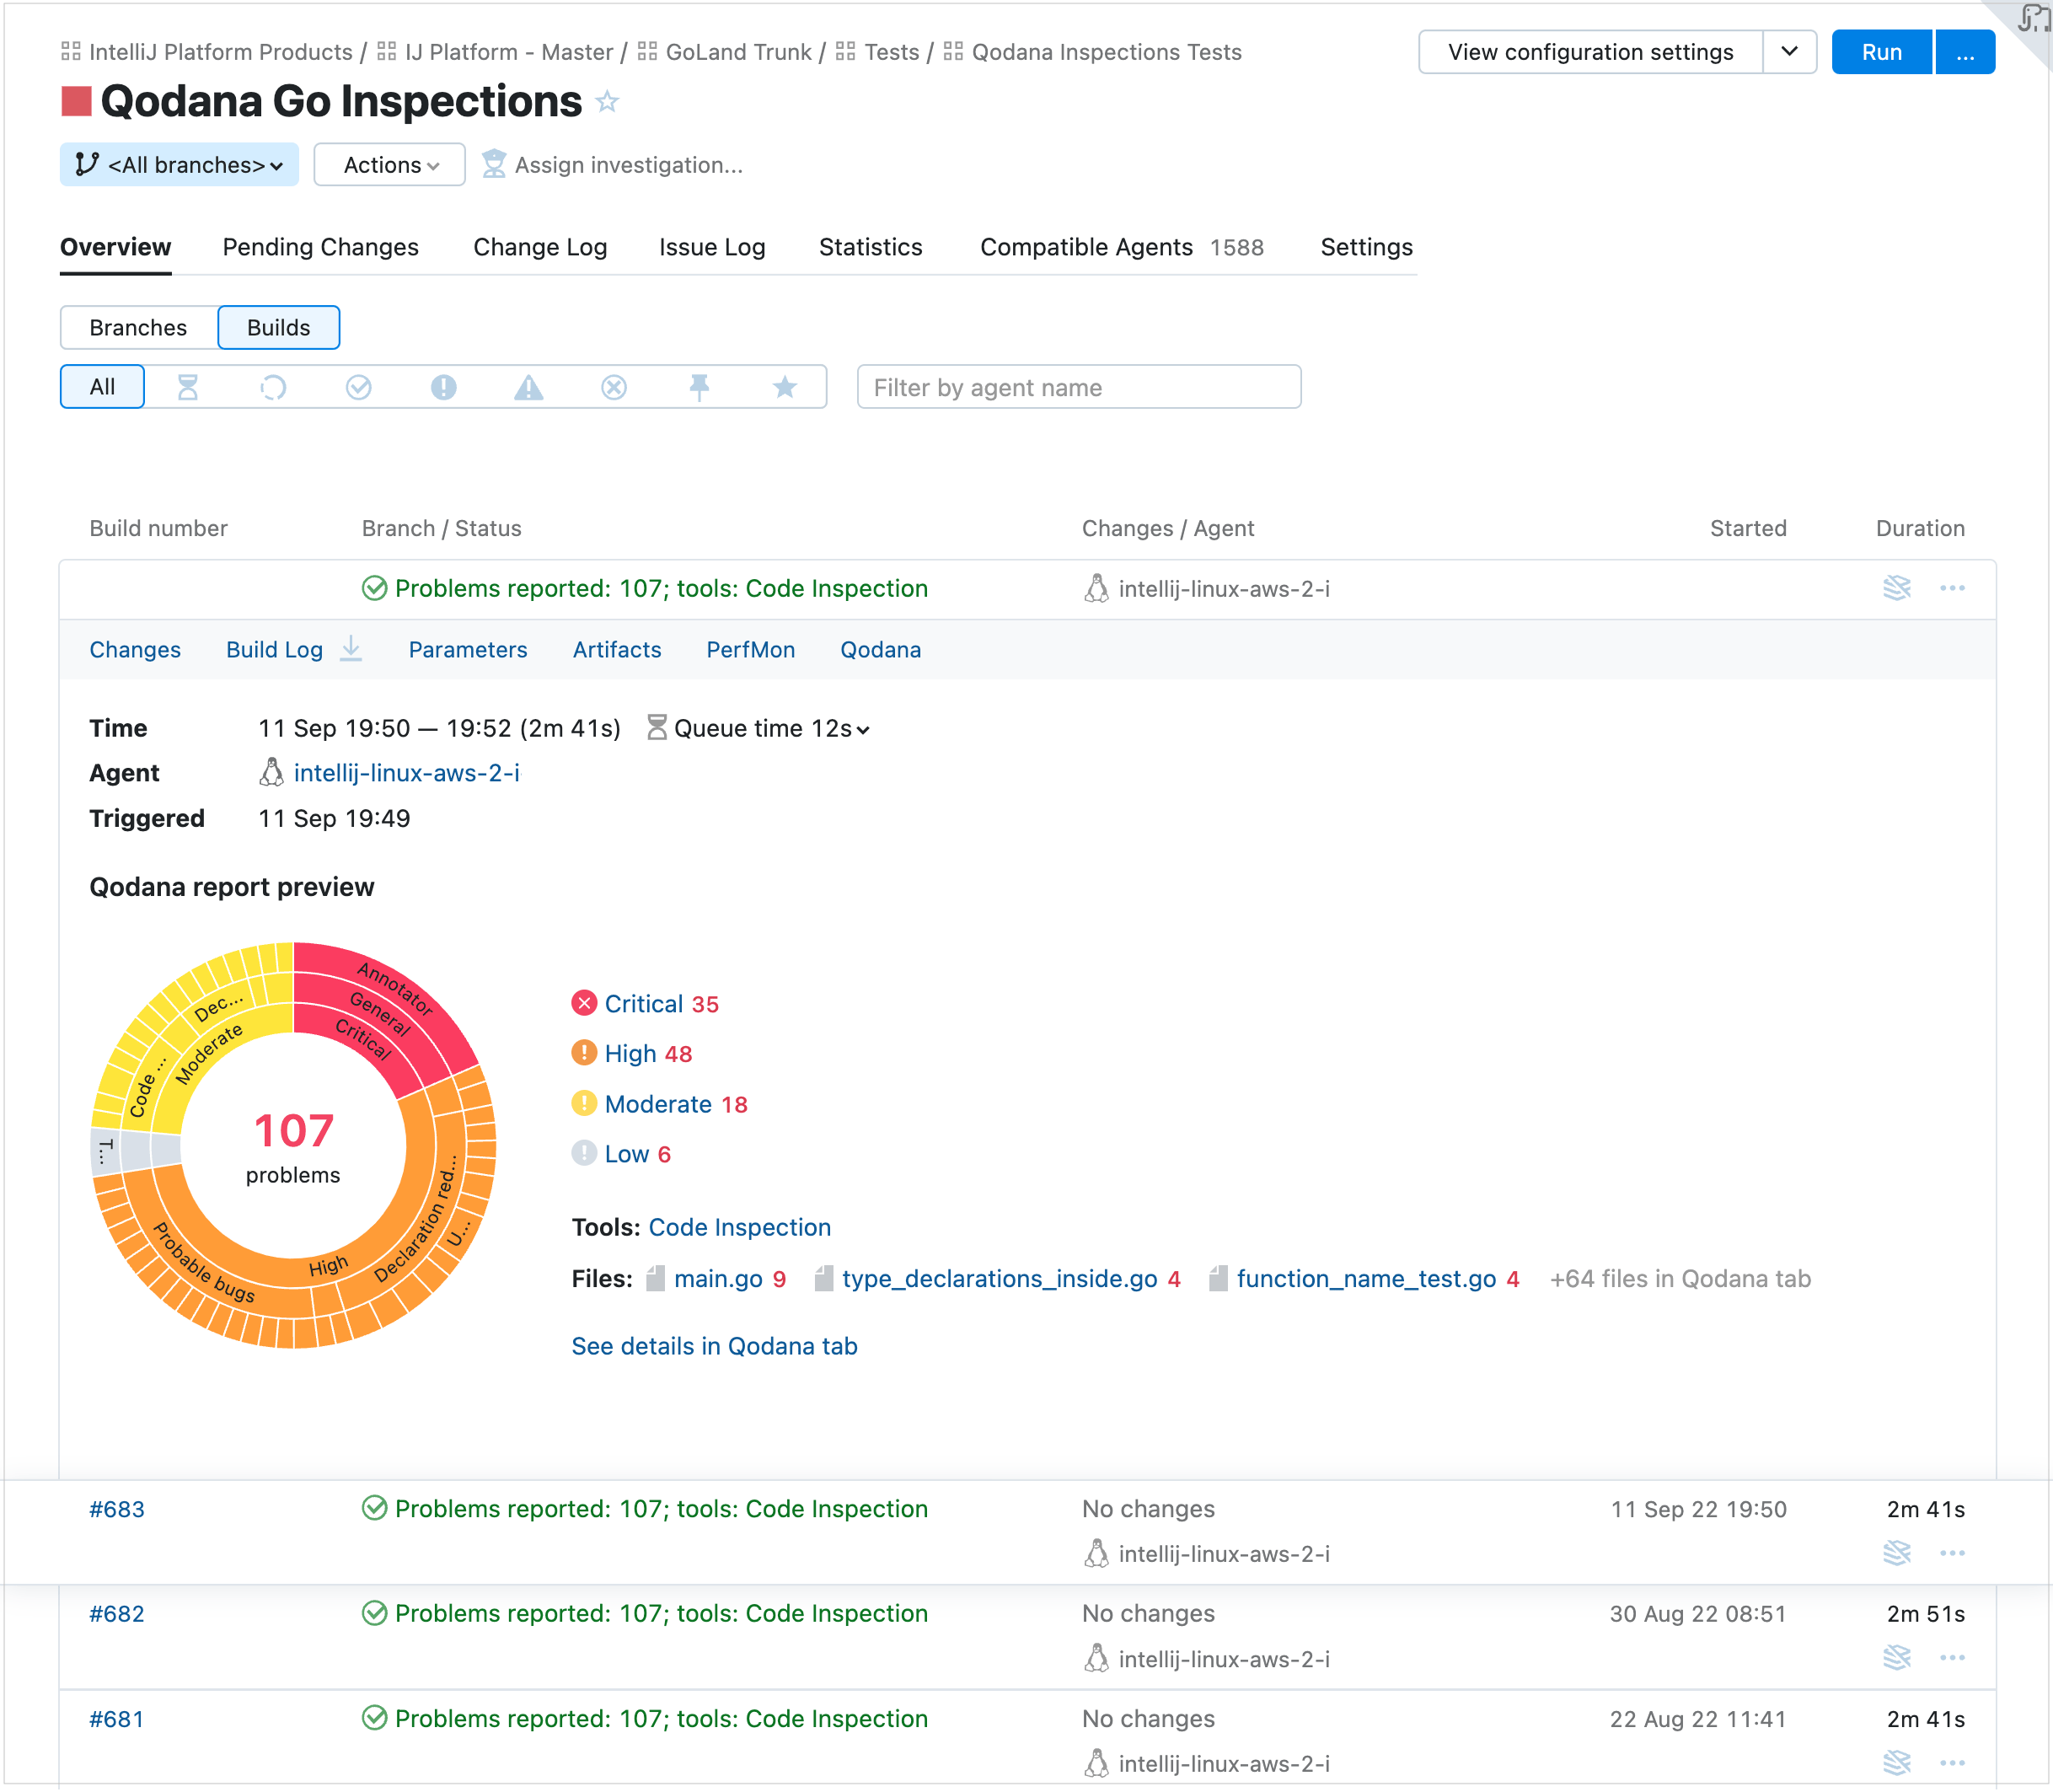
Project Home and Build Configuration Home pages: redesigned Overview tab
Build Results page: redesigned Overview, Tests and Test History, Changes, Build Log, and Dependencies tabs
Agents page
Queue page
Below, you’ll find a recap of these features.
This improved sidebar displays the project hierarchy and, for the Agents page, shows agent hierarchy and serves for better navigation between projects, build configurations, or build agents.
You can change the sidebar width by dragging its frame border and hide/show it anytime by clicking the corresponding button at its bottom.
To customize a sidebar, click ![]() in its upper-right corner. In the customization menu, you can move a project or build configuration in the list via a keyboard or using the arrow UI button, or mark/clear projects as your favorite.
in its upper-right corner. In the customization menu, you can move a project or build configuration in the list via a keyboard or using the arrow UI button, or mark/clear projects as your favorite.
The Projects sidebar lists all the projects available to the current TeamCity user and allows searching them by name. You can expand any project to see its nested subprojects / build configurations and quickly switch between them. The status icons and counters for all its nested objects are also displayed in the sidebar.
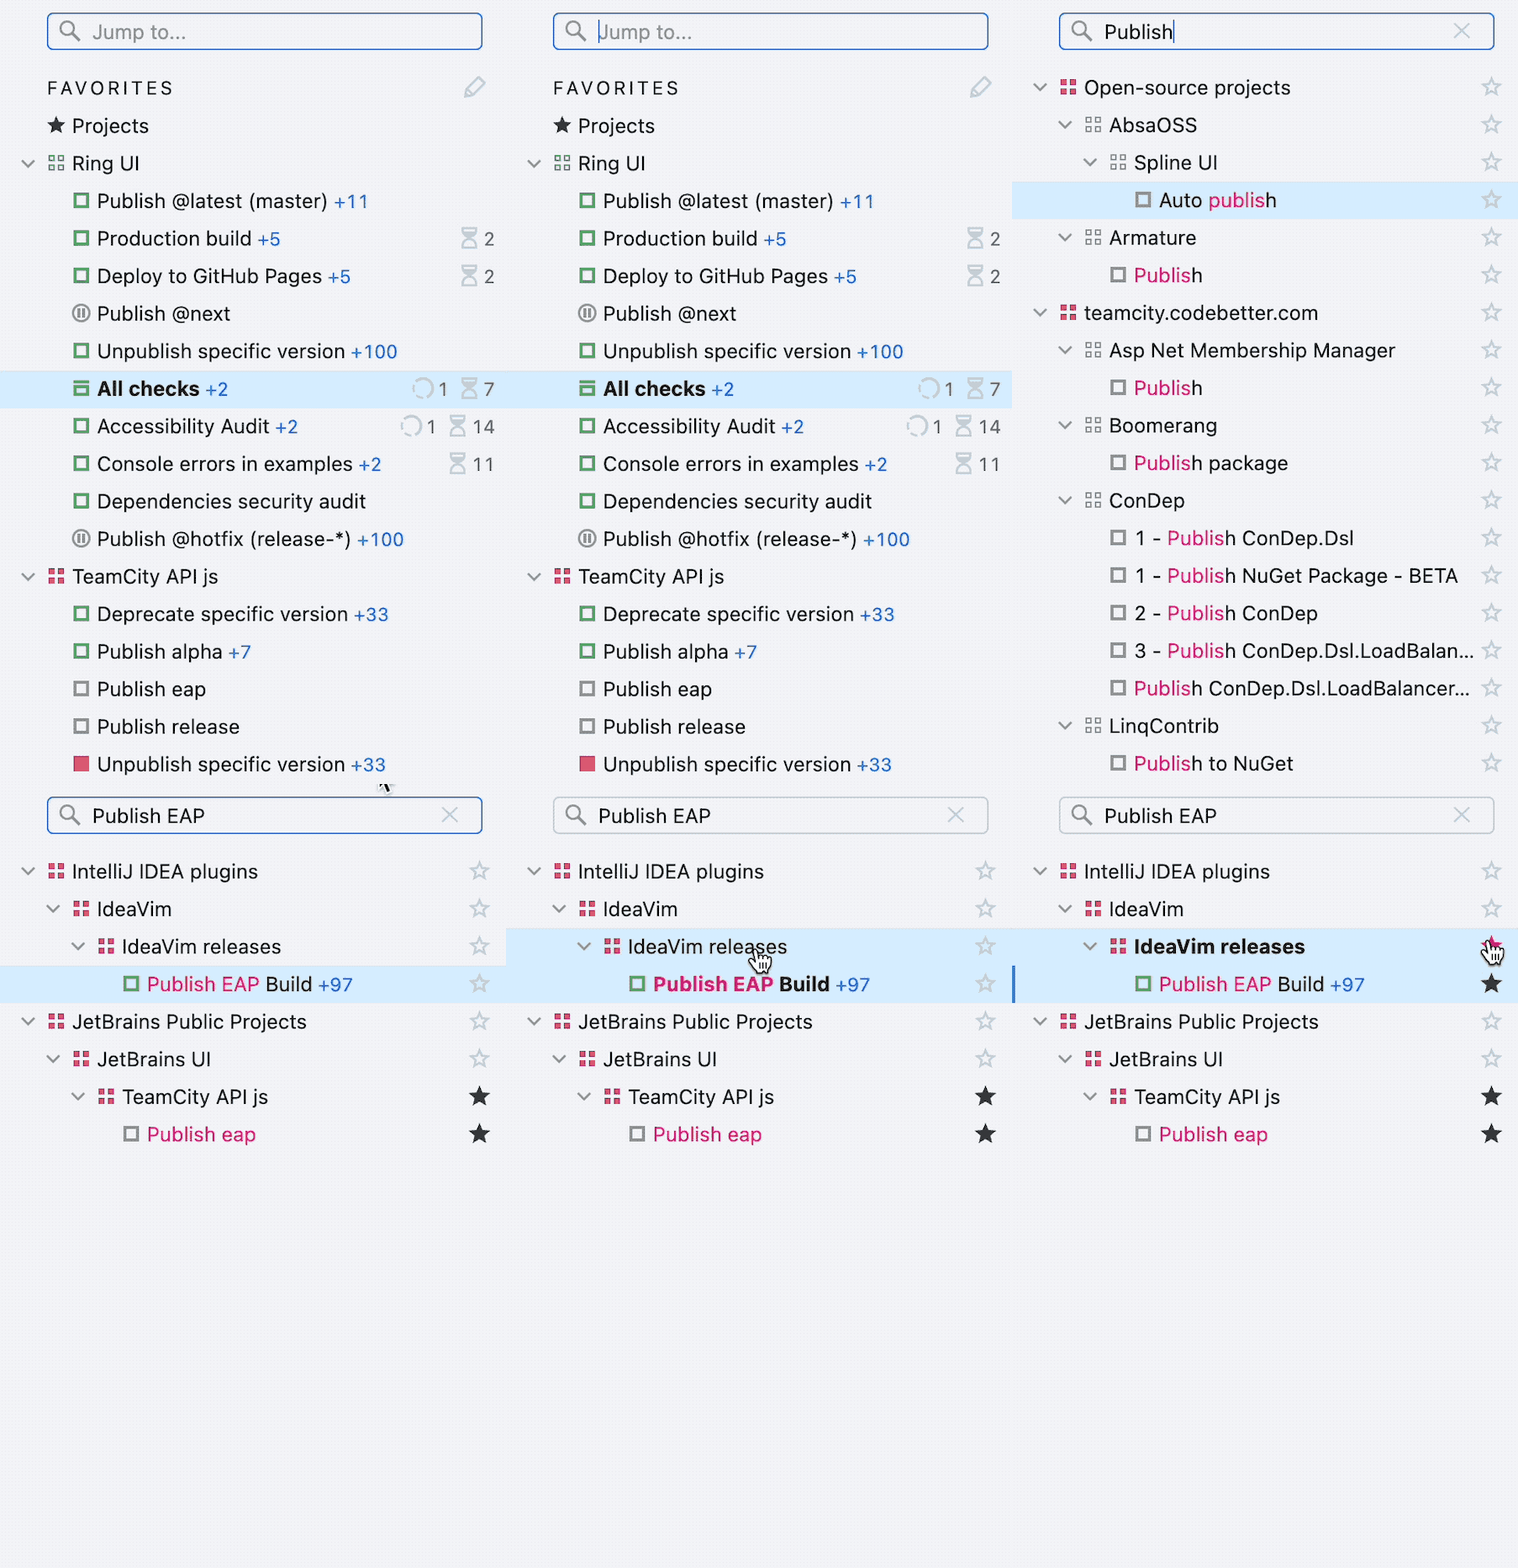
The sidebar allows accessing the Favorite projects and Favorite builds views with the lists of your favorite projects and favorite build configurations respectively.
You can also toggle the display of archived projects.
You can use the Q keyboard shortcut to focus on the projects' search field. When focused, use ↑ and ↓ keyboard arrows to navigate between search results. To remove the focus, press Esc.
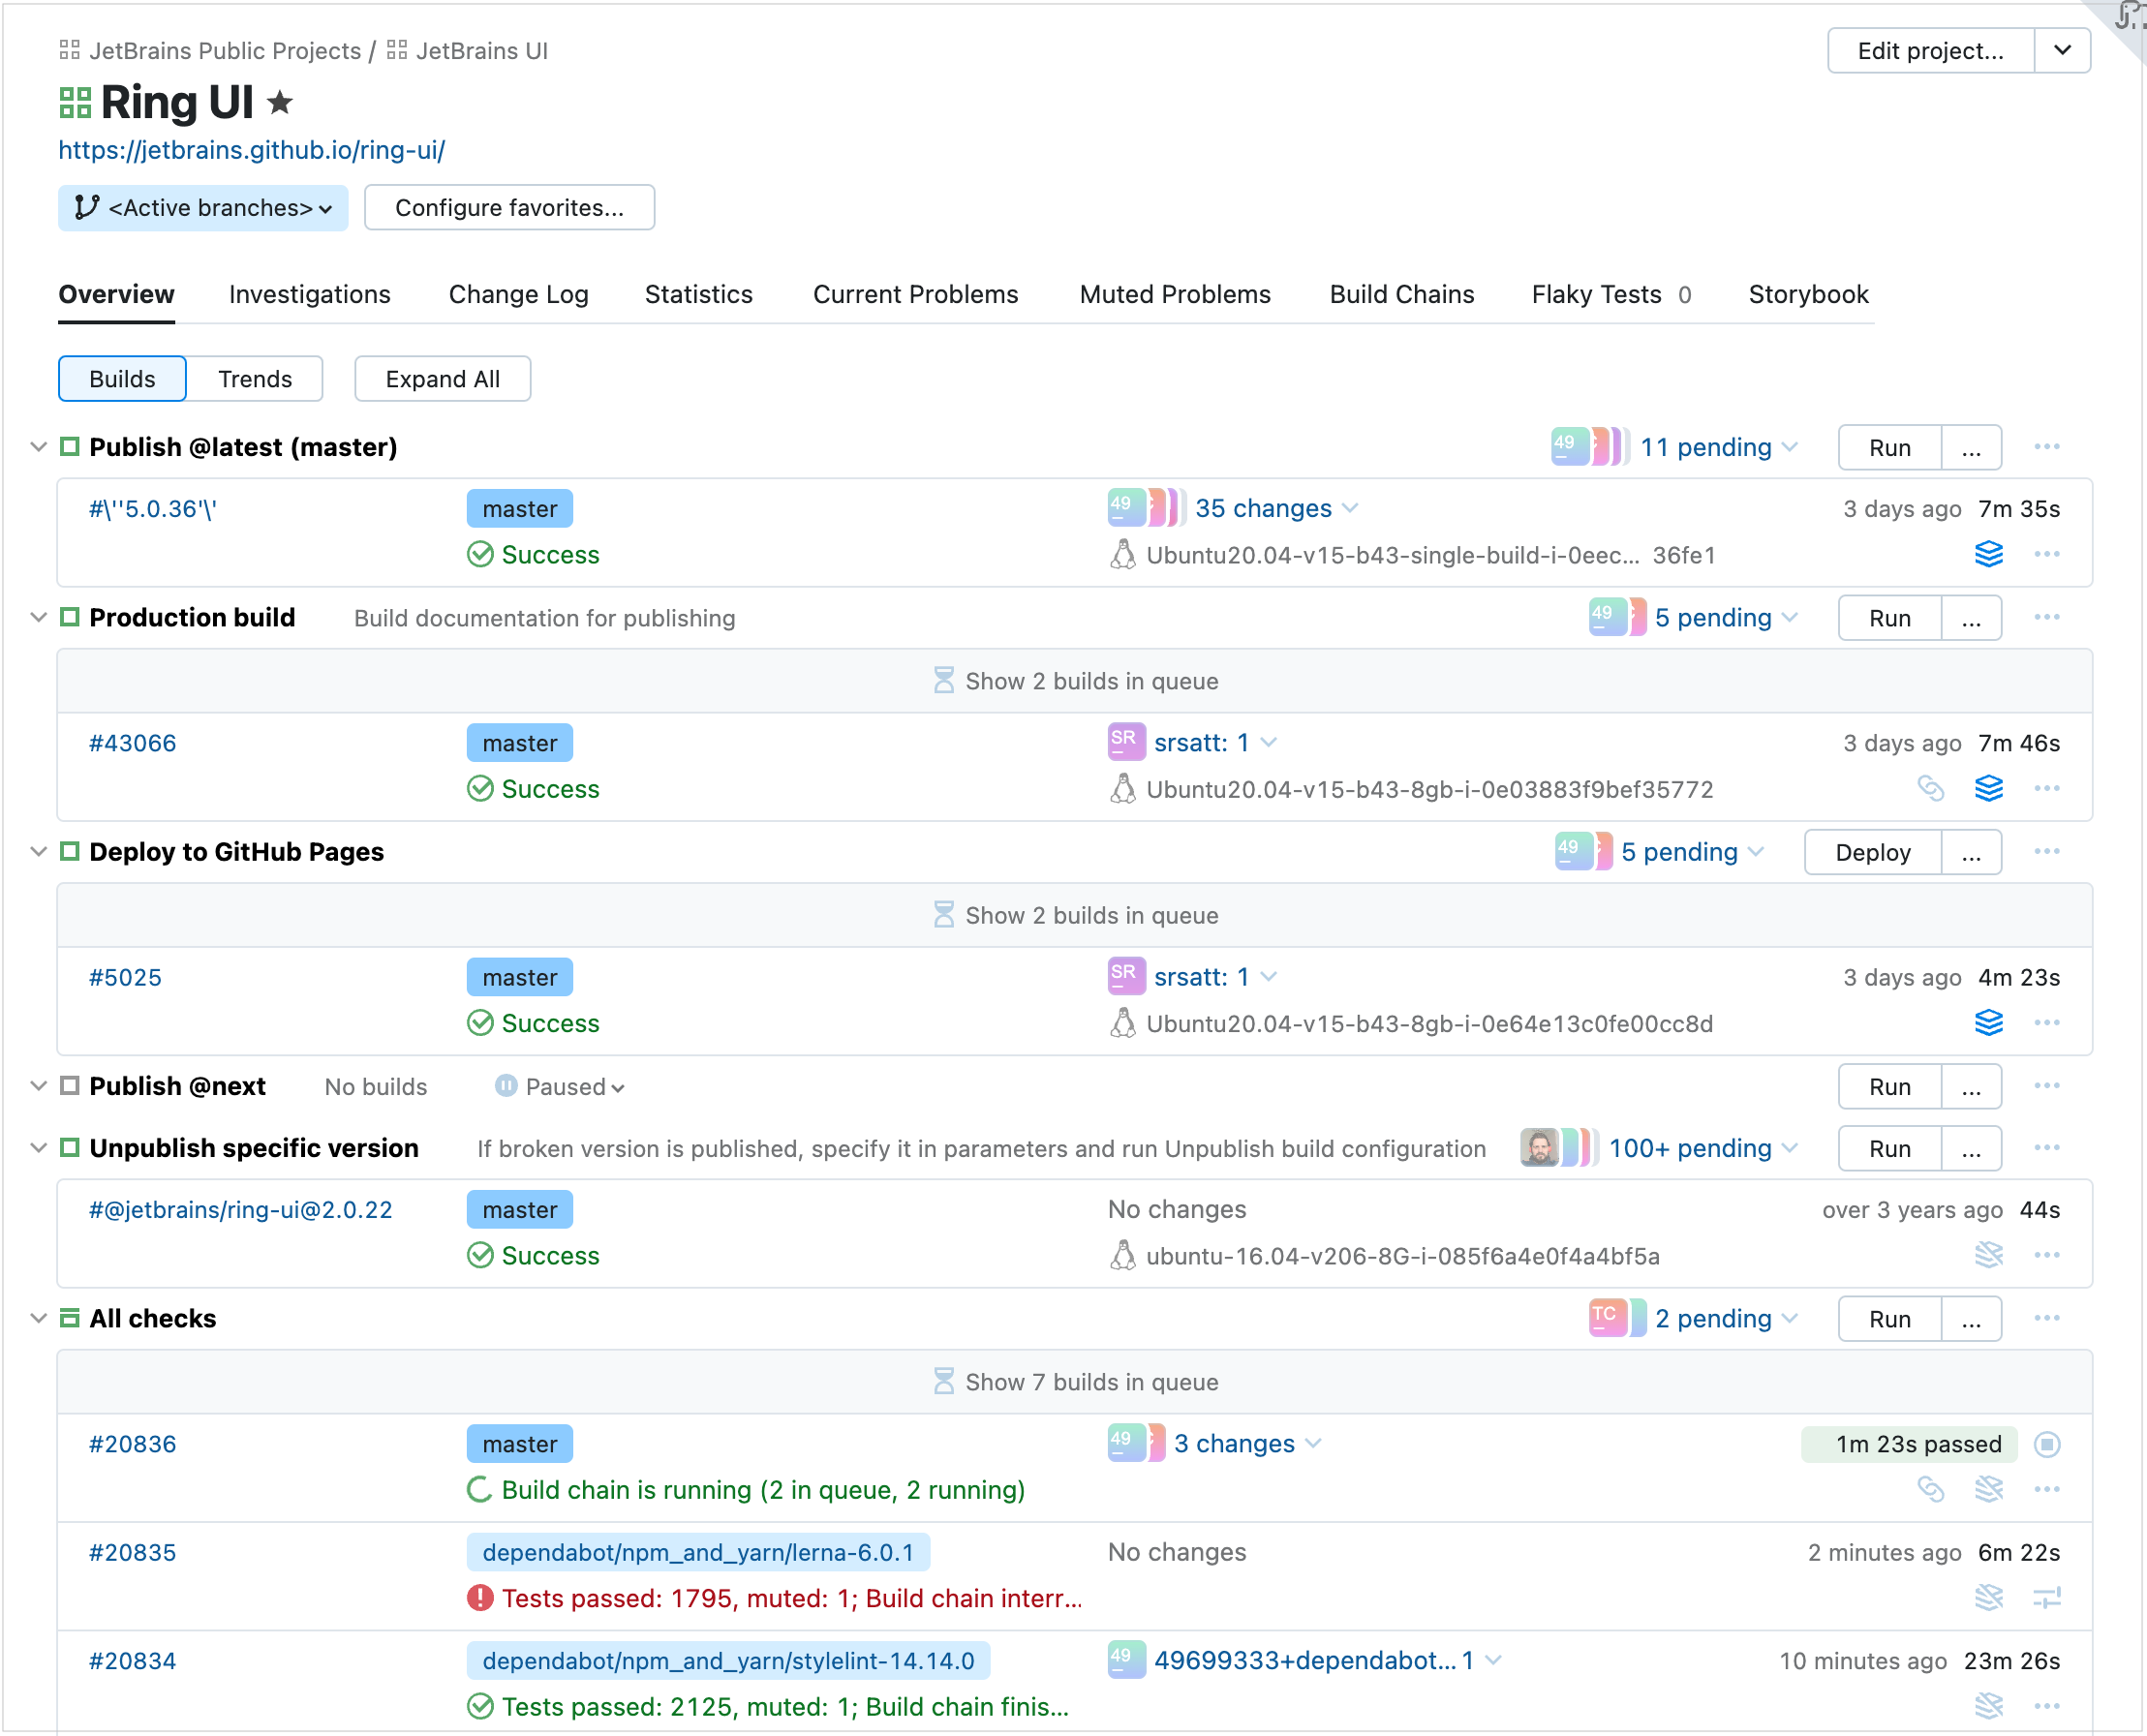
The Overview tab of the Project Home page provides more visibility of the project's subprojects and build configurations. The page has two main views: Builds and Trends.
The Trends view comprises cards that represent build configurations of the selected project.
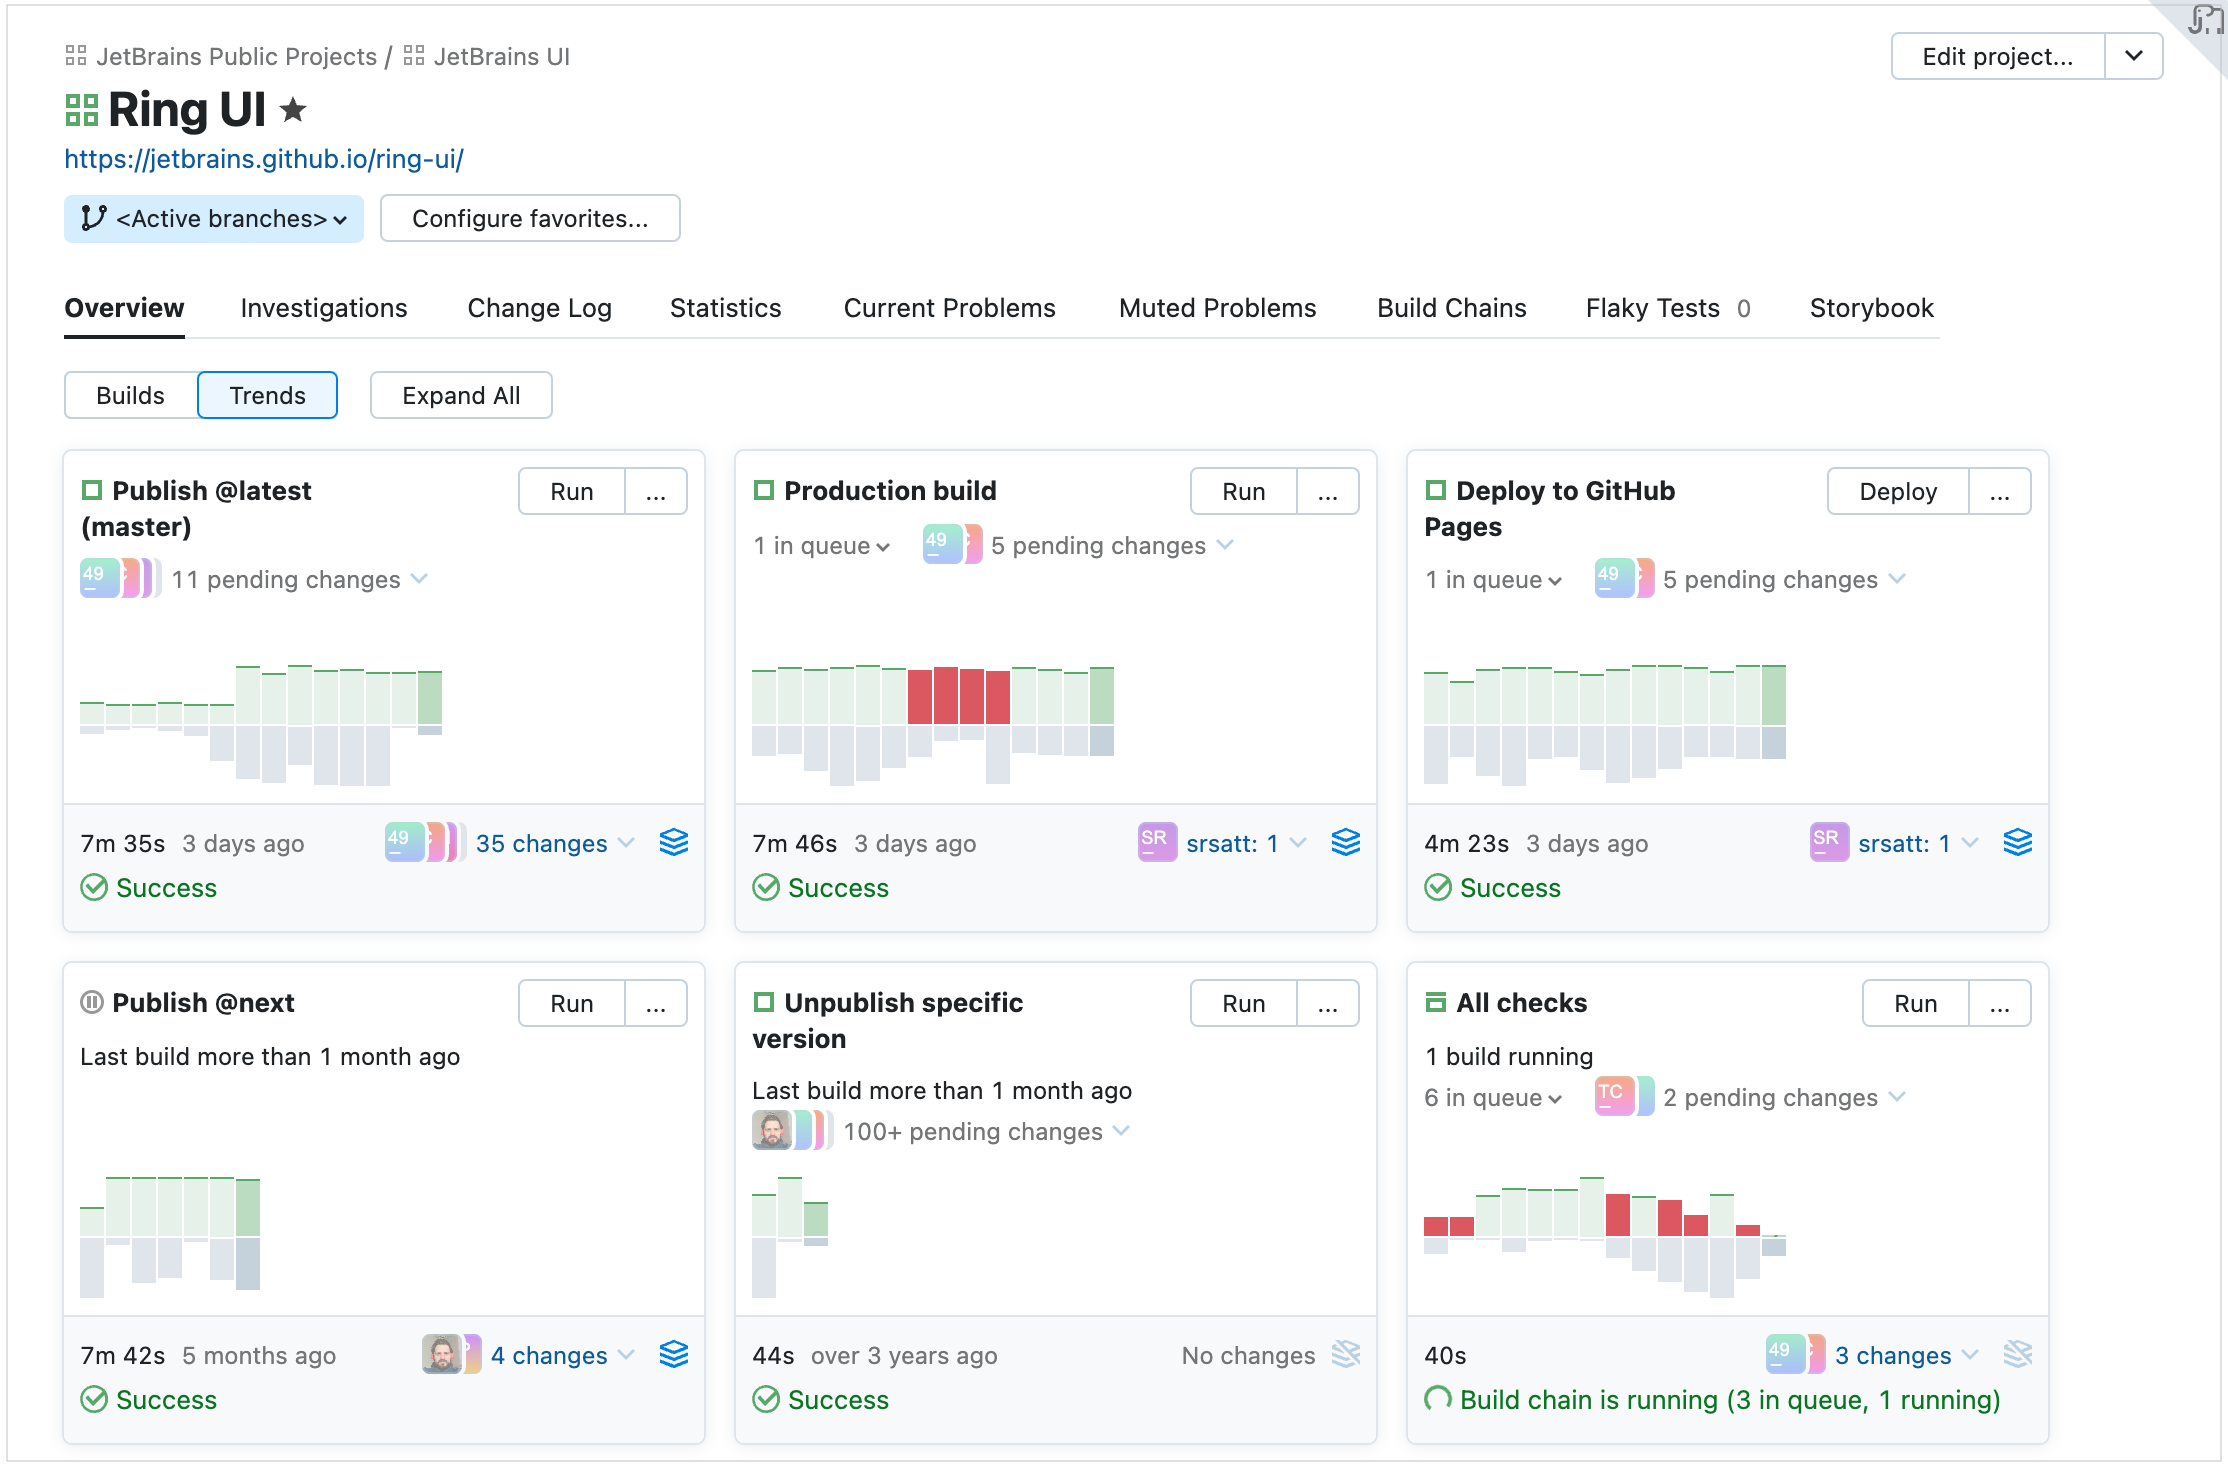
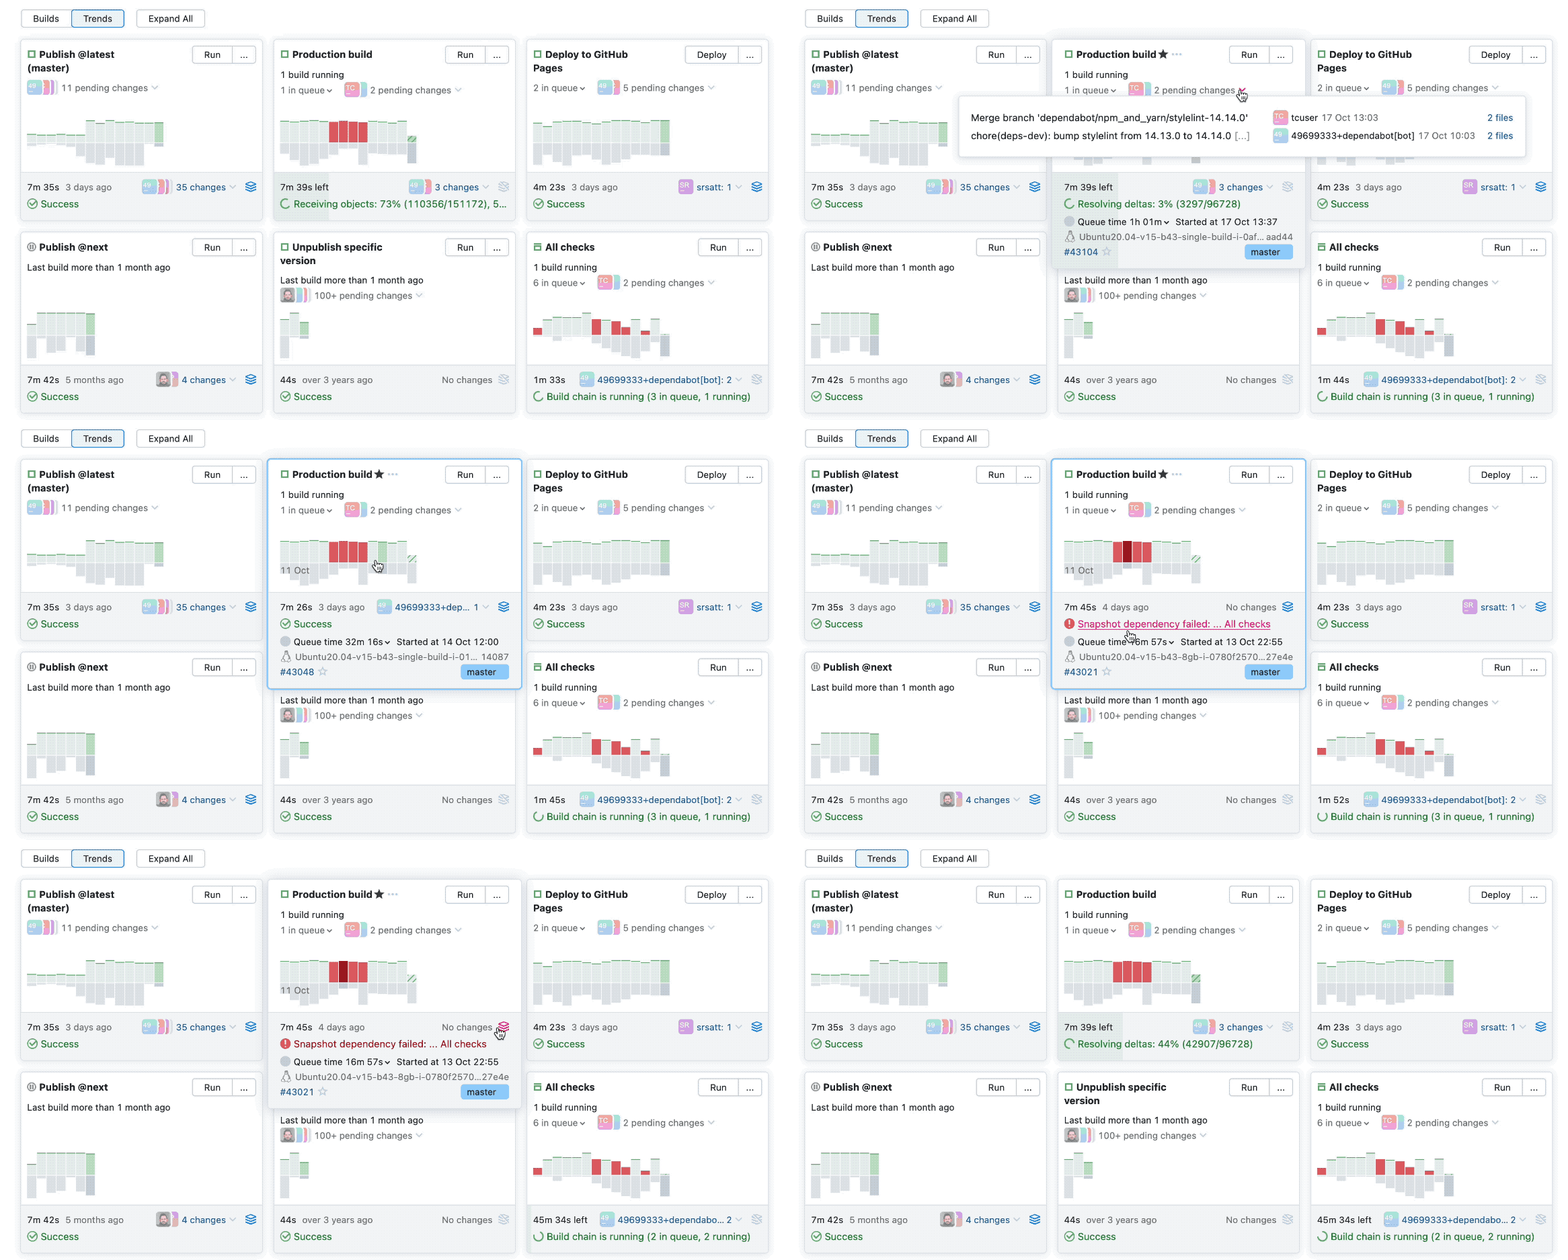
Each card contains a preview of the most recent builds displayed as bars on a timescale. You can hover over any bar to instantly see more information about the build: its duration, queue statistics, test results, used agent, and more. The card also displays the number of pending changes.
The Builds view is similar to the classic UI and displays the list of the recent builds in subprojects and build configurations of the current project.
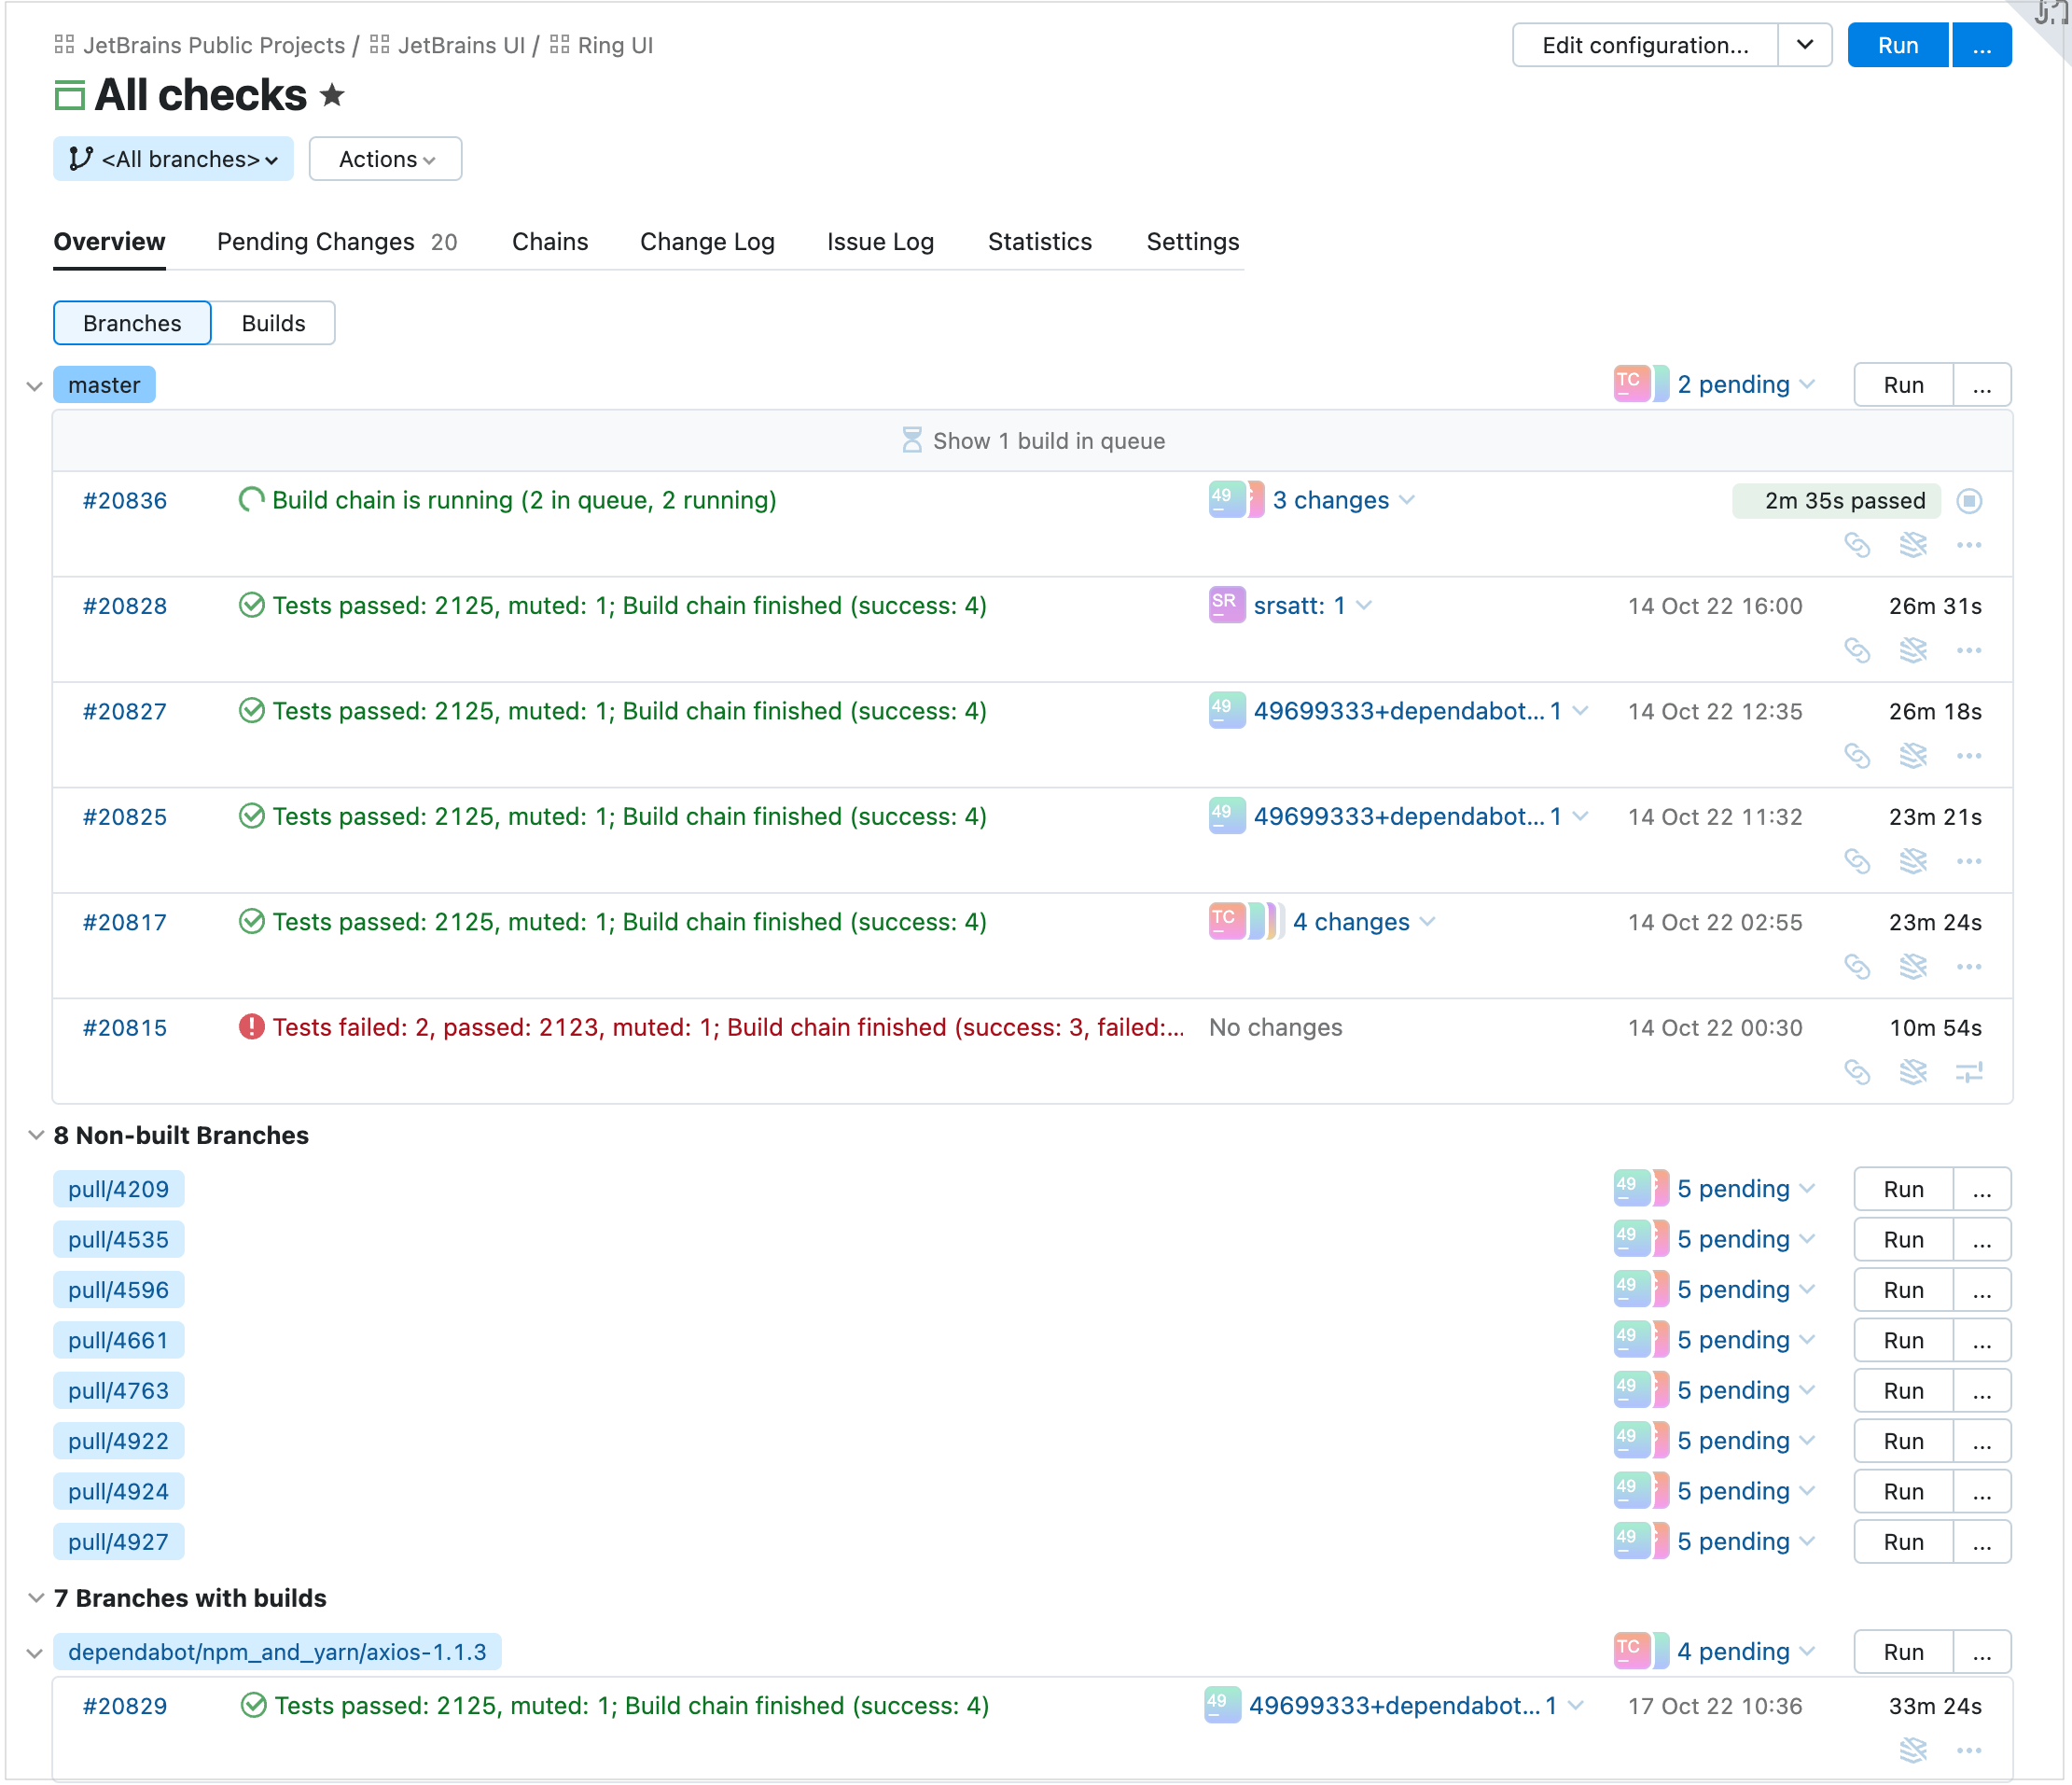
The Overview tab of the Sakura Build Configuration Home page provides two views:
Branches, listing the recent builds in active branches
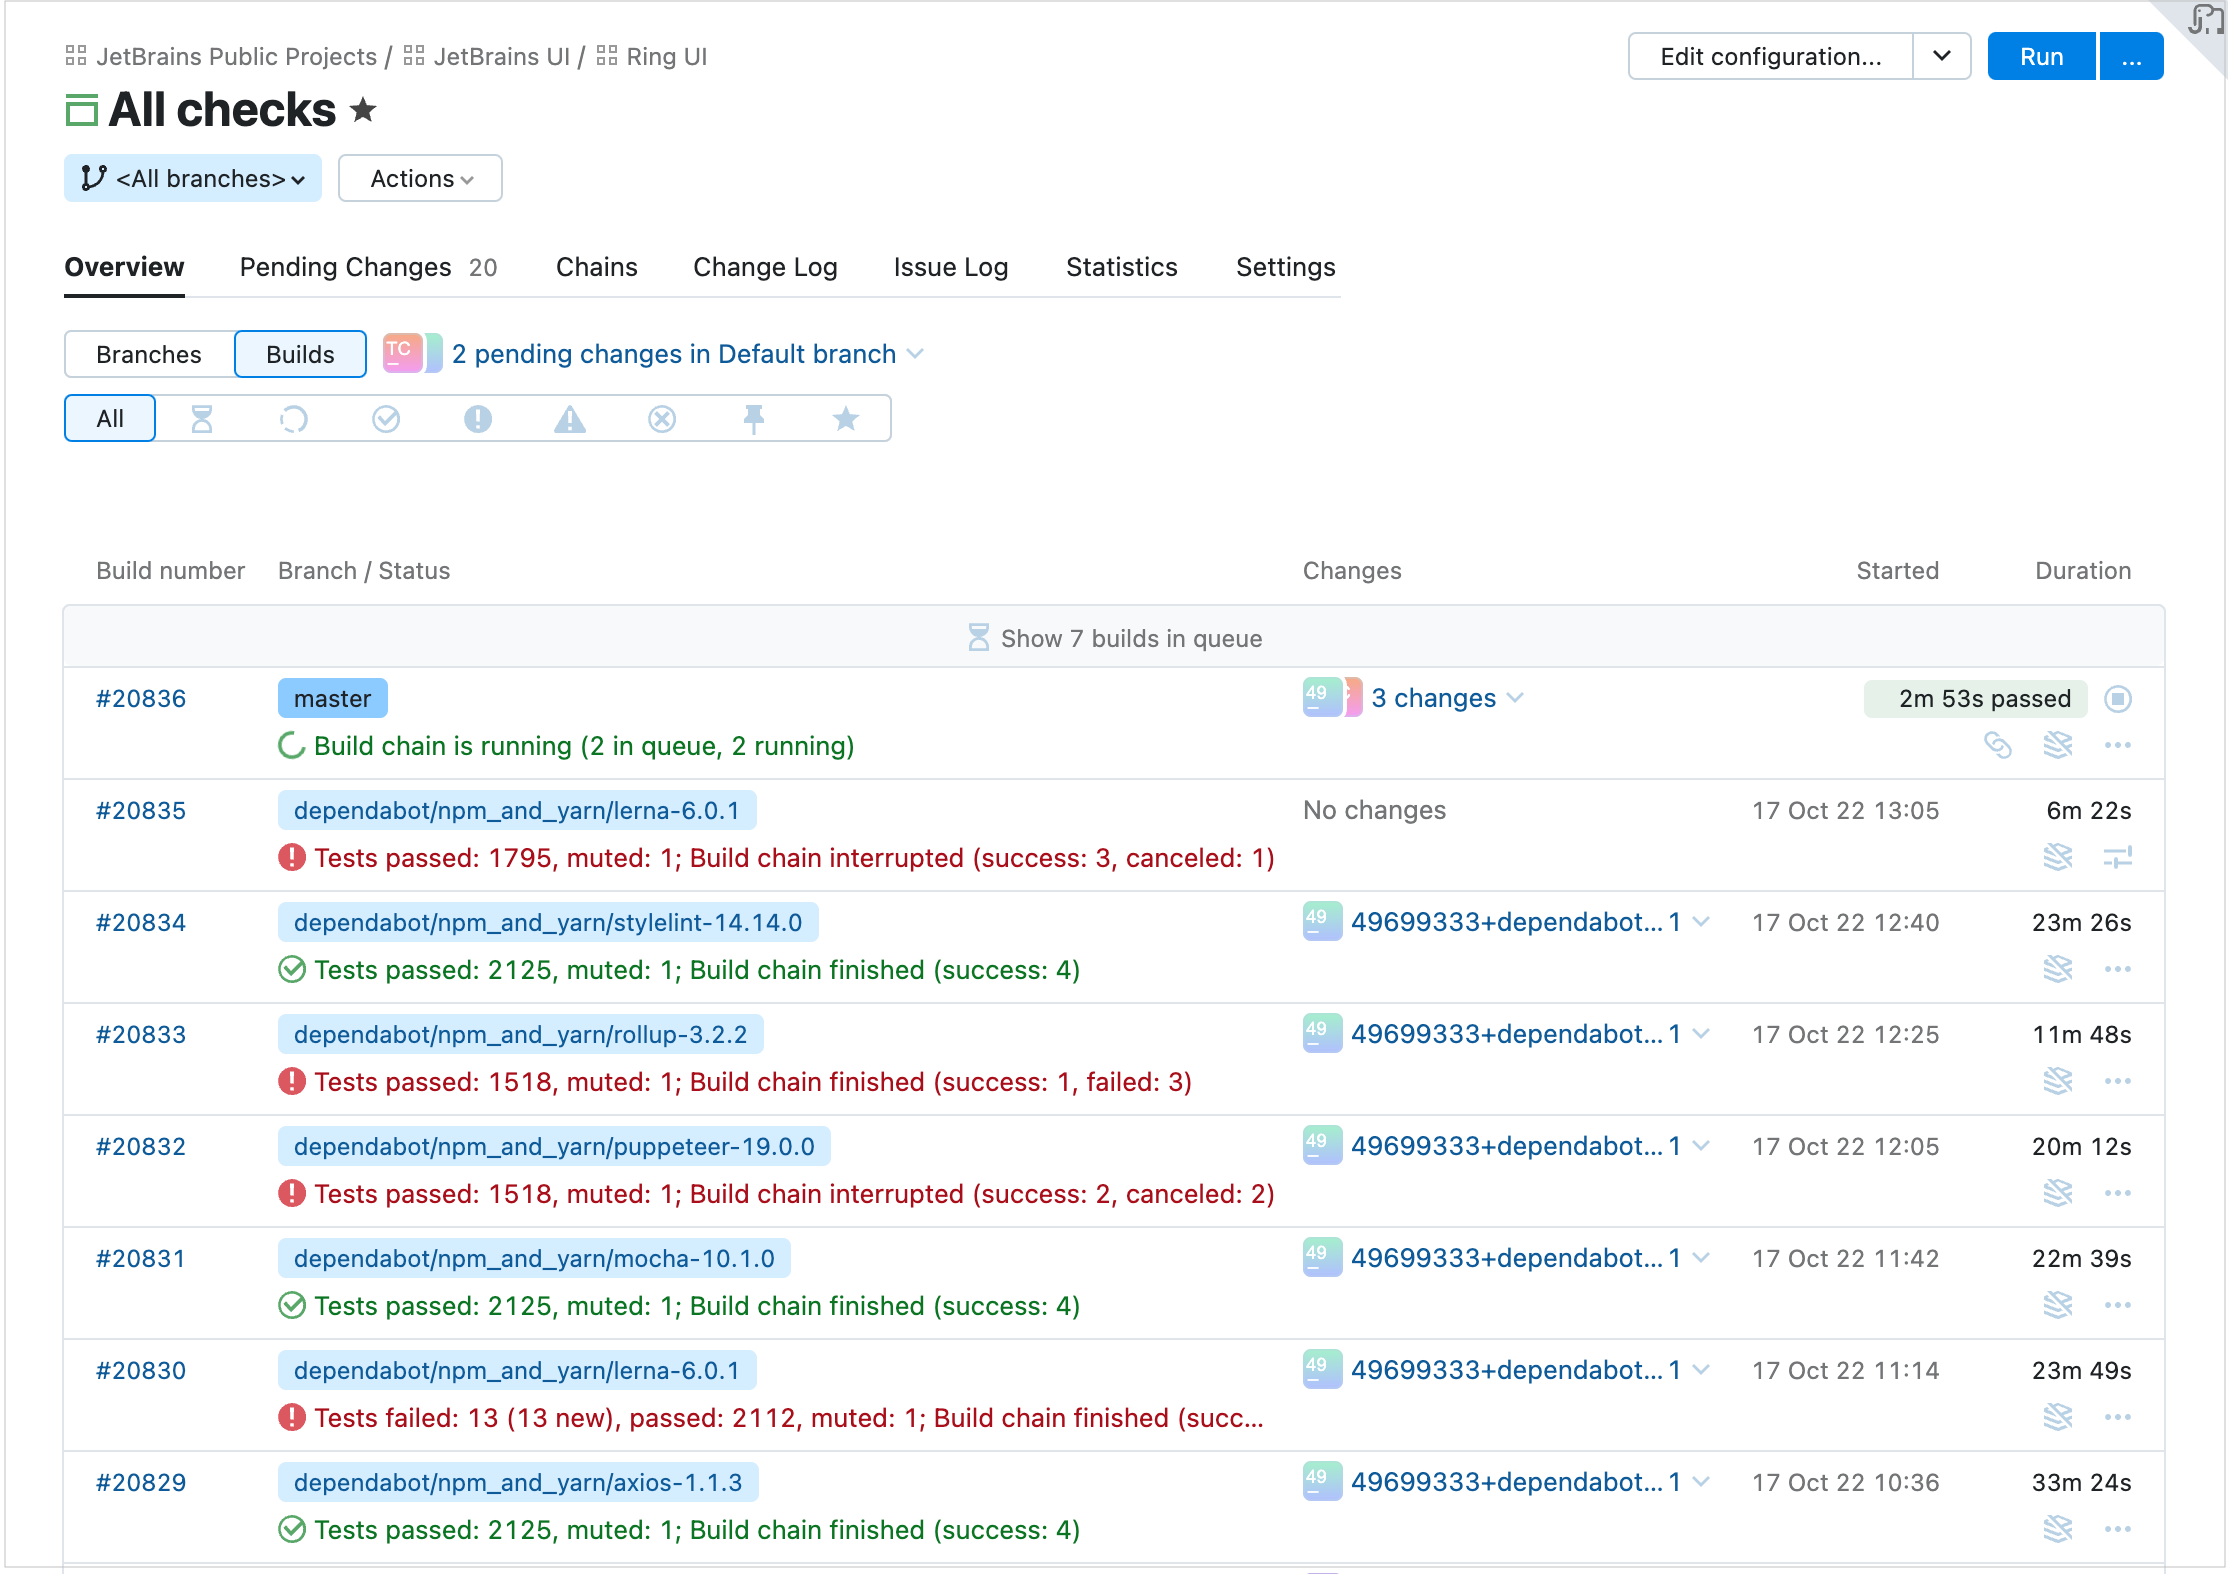
Builds, listing all the recent builds of the configuration
Every build item in the list is expandable: click it to preview the most important information about the build and get quick access to any of the Build Results tabs.
Click a specific build problem or failed test to see the related stack trace:
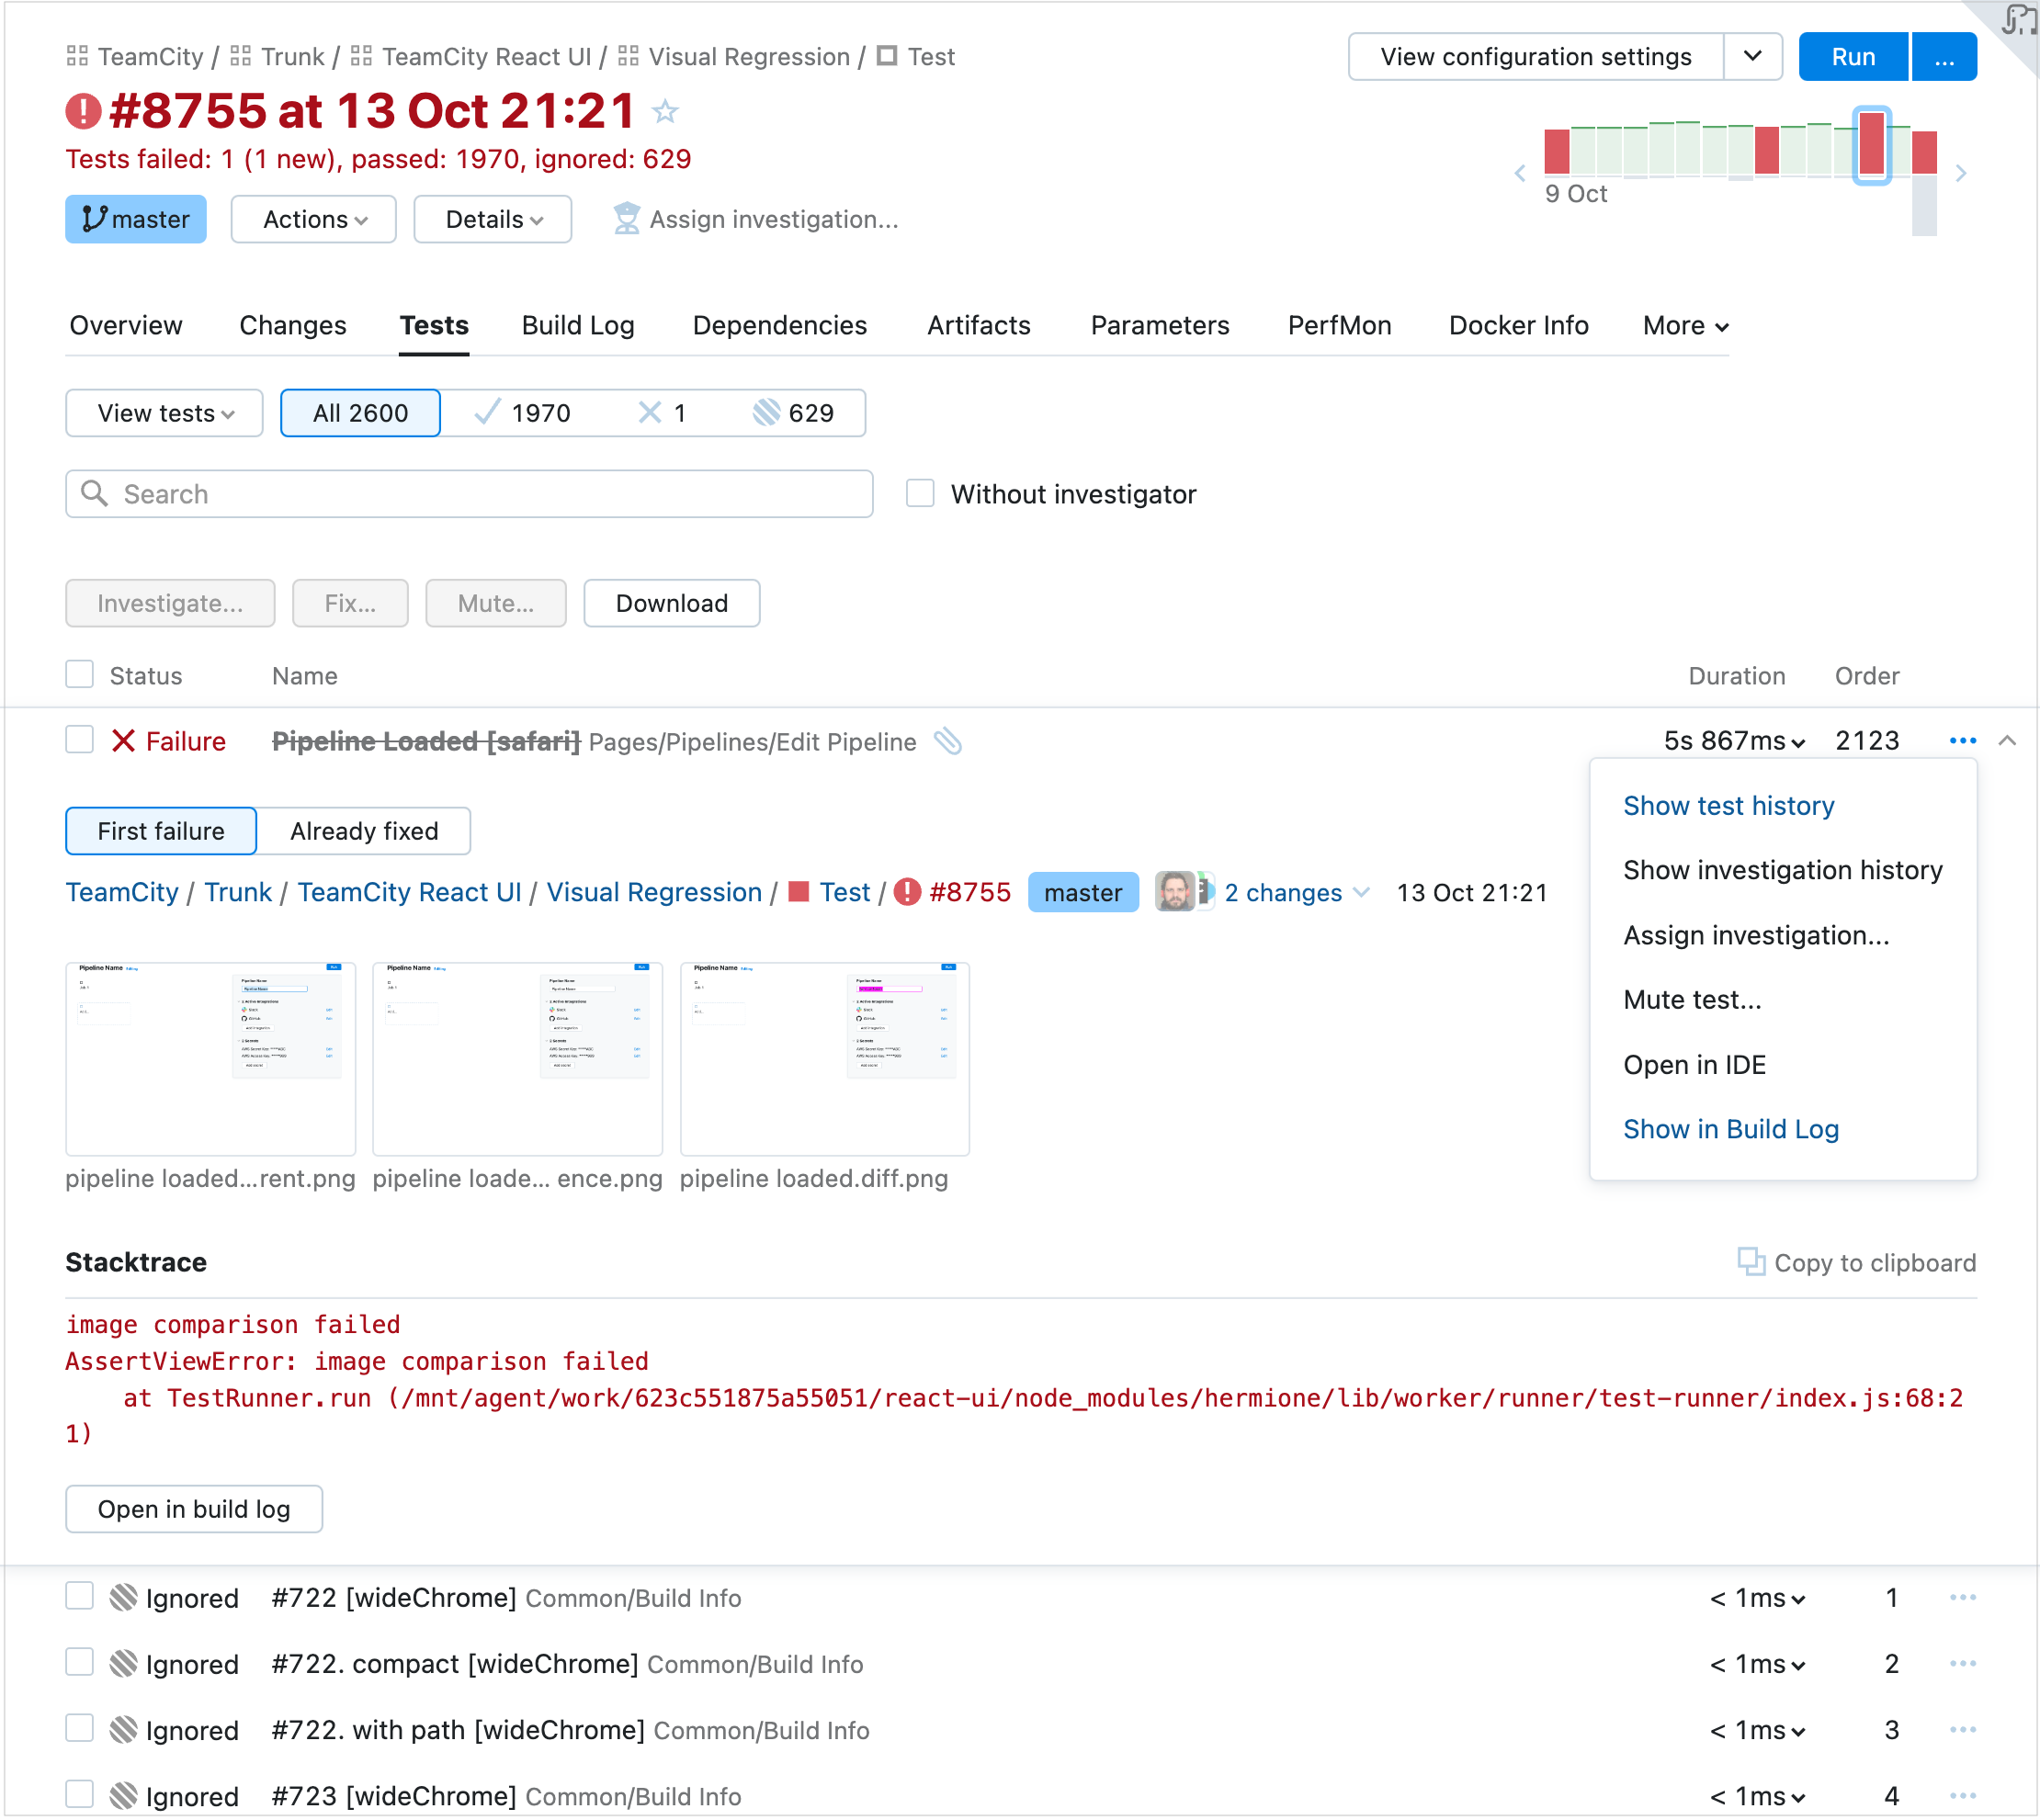
Click Open in build log to open the new build log exactly at the line where the problem occurred.
The Changes pop-up block displays build changes sorted chronologically and grouped by their origin: user commits to the code and changes in artifact dependencies. You can also filter the changes by their author and display changes made in the build configuration settings.
Example of the Changes pop-up block:

This page visualizes build results and provides several handy widgets.
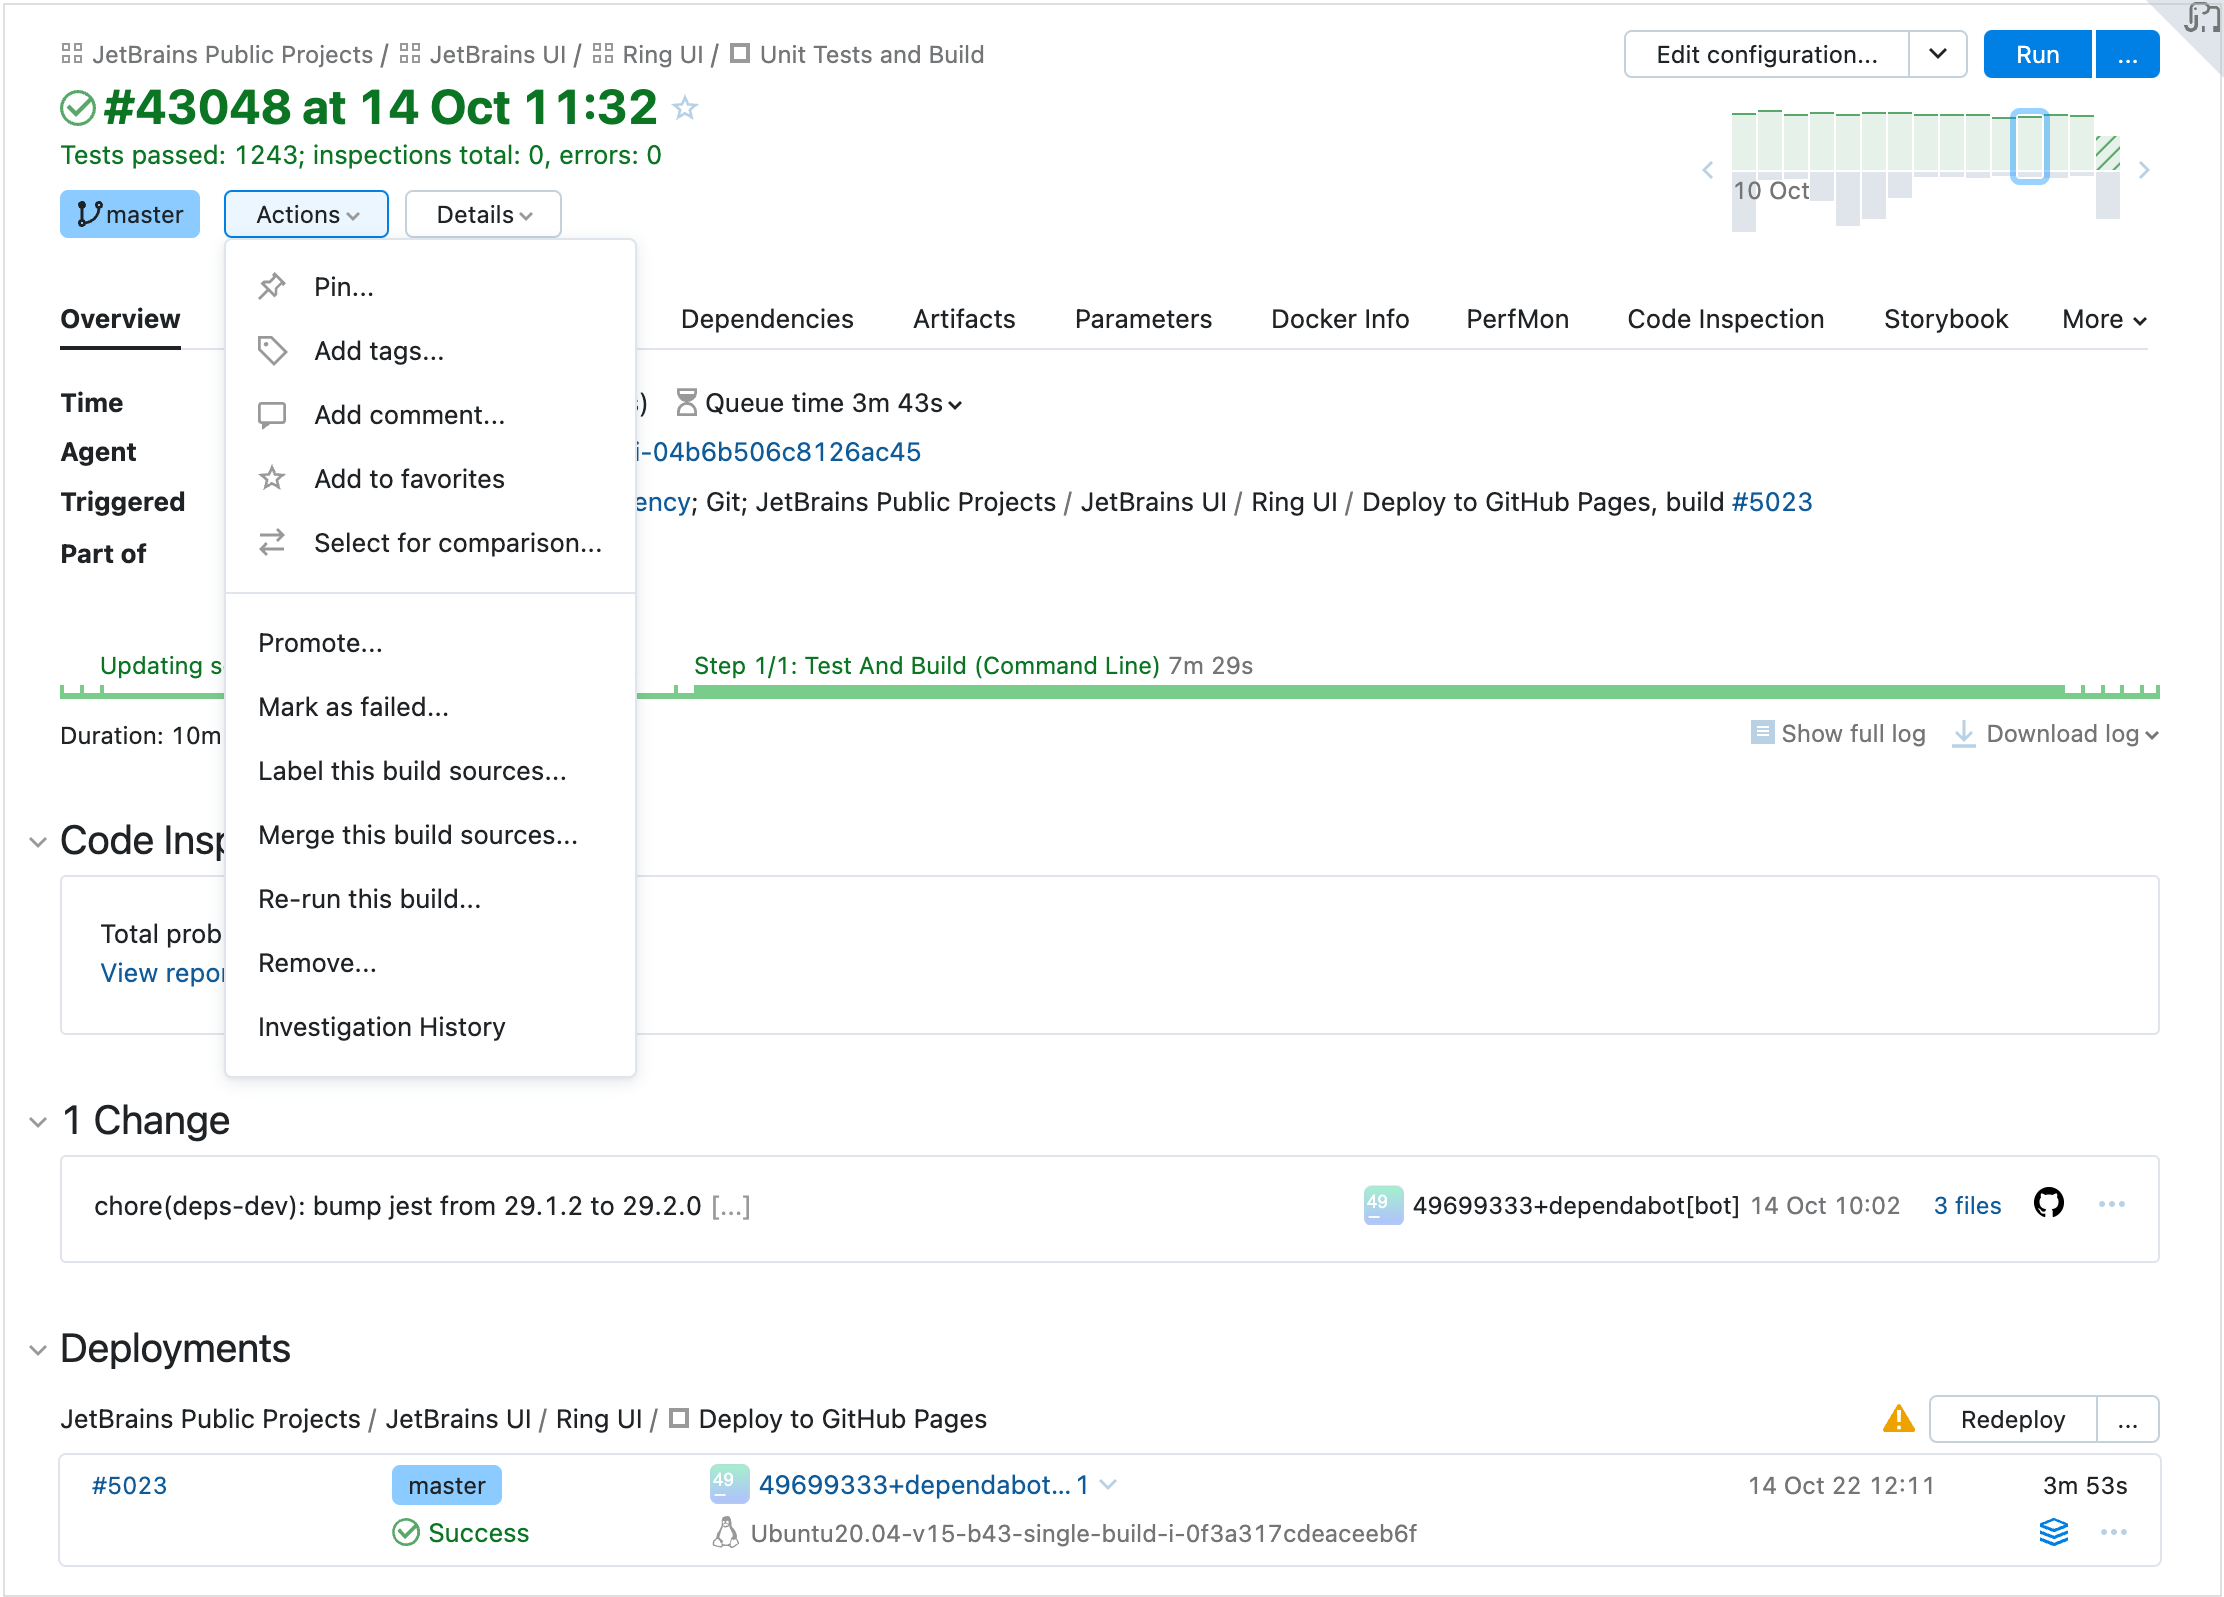
The Actions menu offers several handy options:
tip
Choose Select for comparison to compare the parameters and results of the current build with any other selected build side-by-side. This option is also available from the build's context menu in the build list.
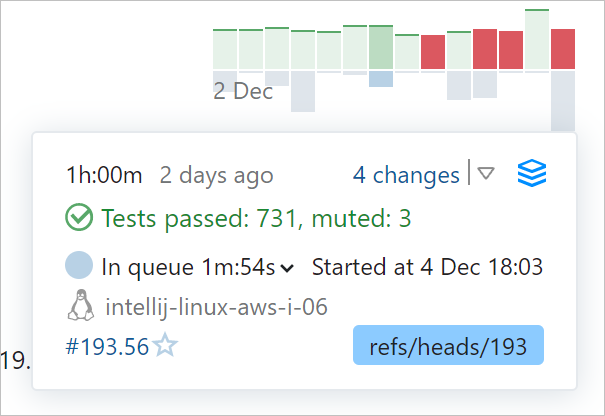
In the upper right corner, you can see the trends for the previous builds of the current build configuration. Hovering over a bar brings up a pop-up with the build details.
The interactive graphic timeline reflects the duration of each build stage and indicates build problems if any:

Click any stage to open the corresponding line of the build log. The long logs can also be displayed directly in the preview, without downloading.
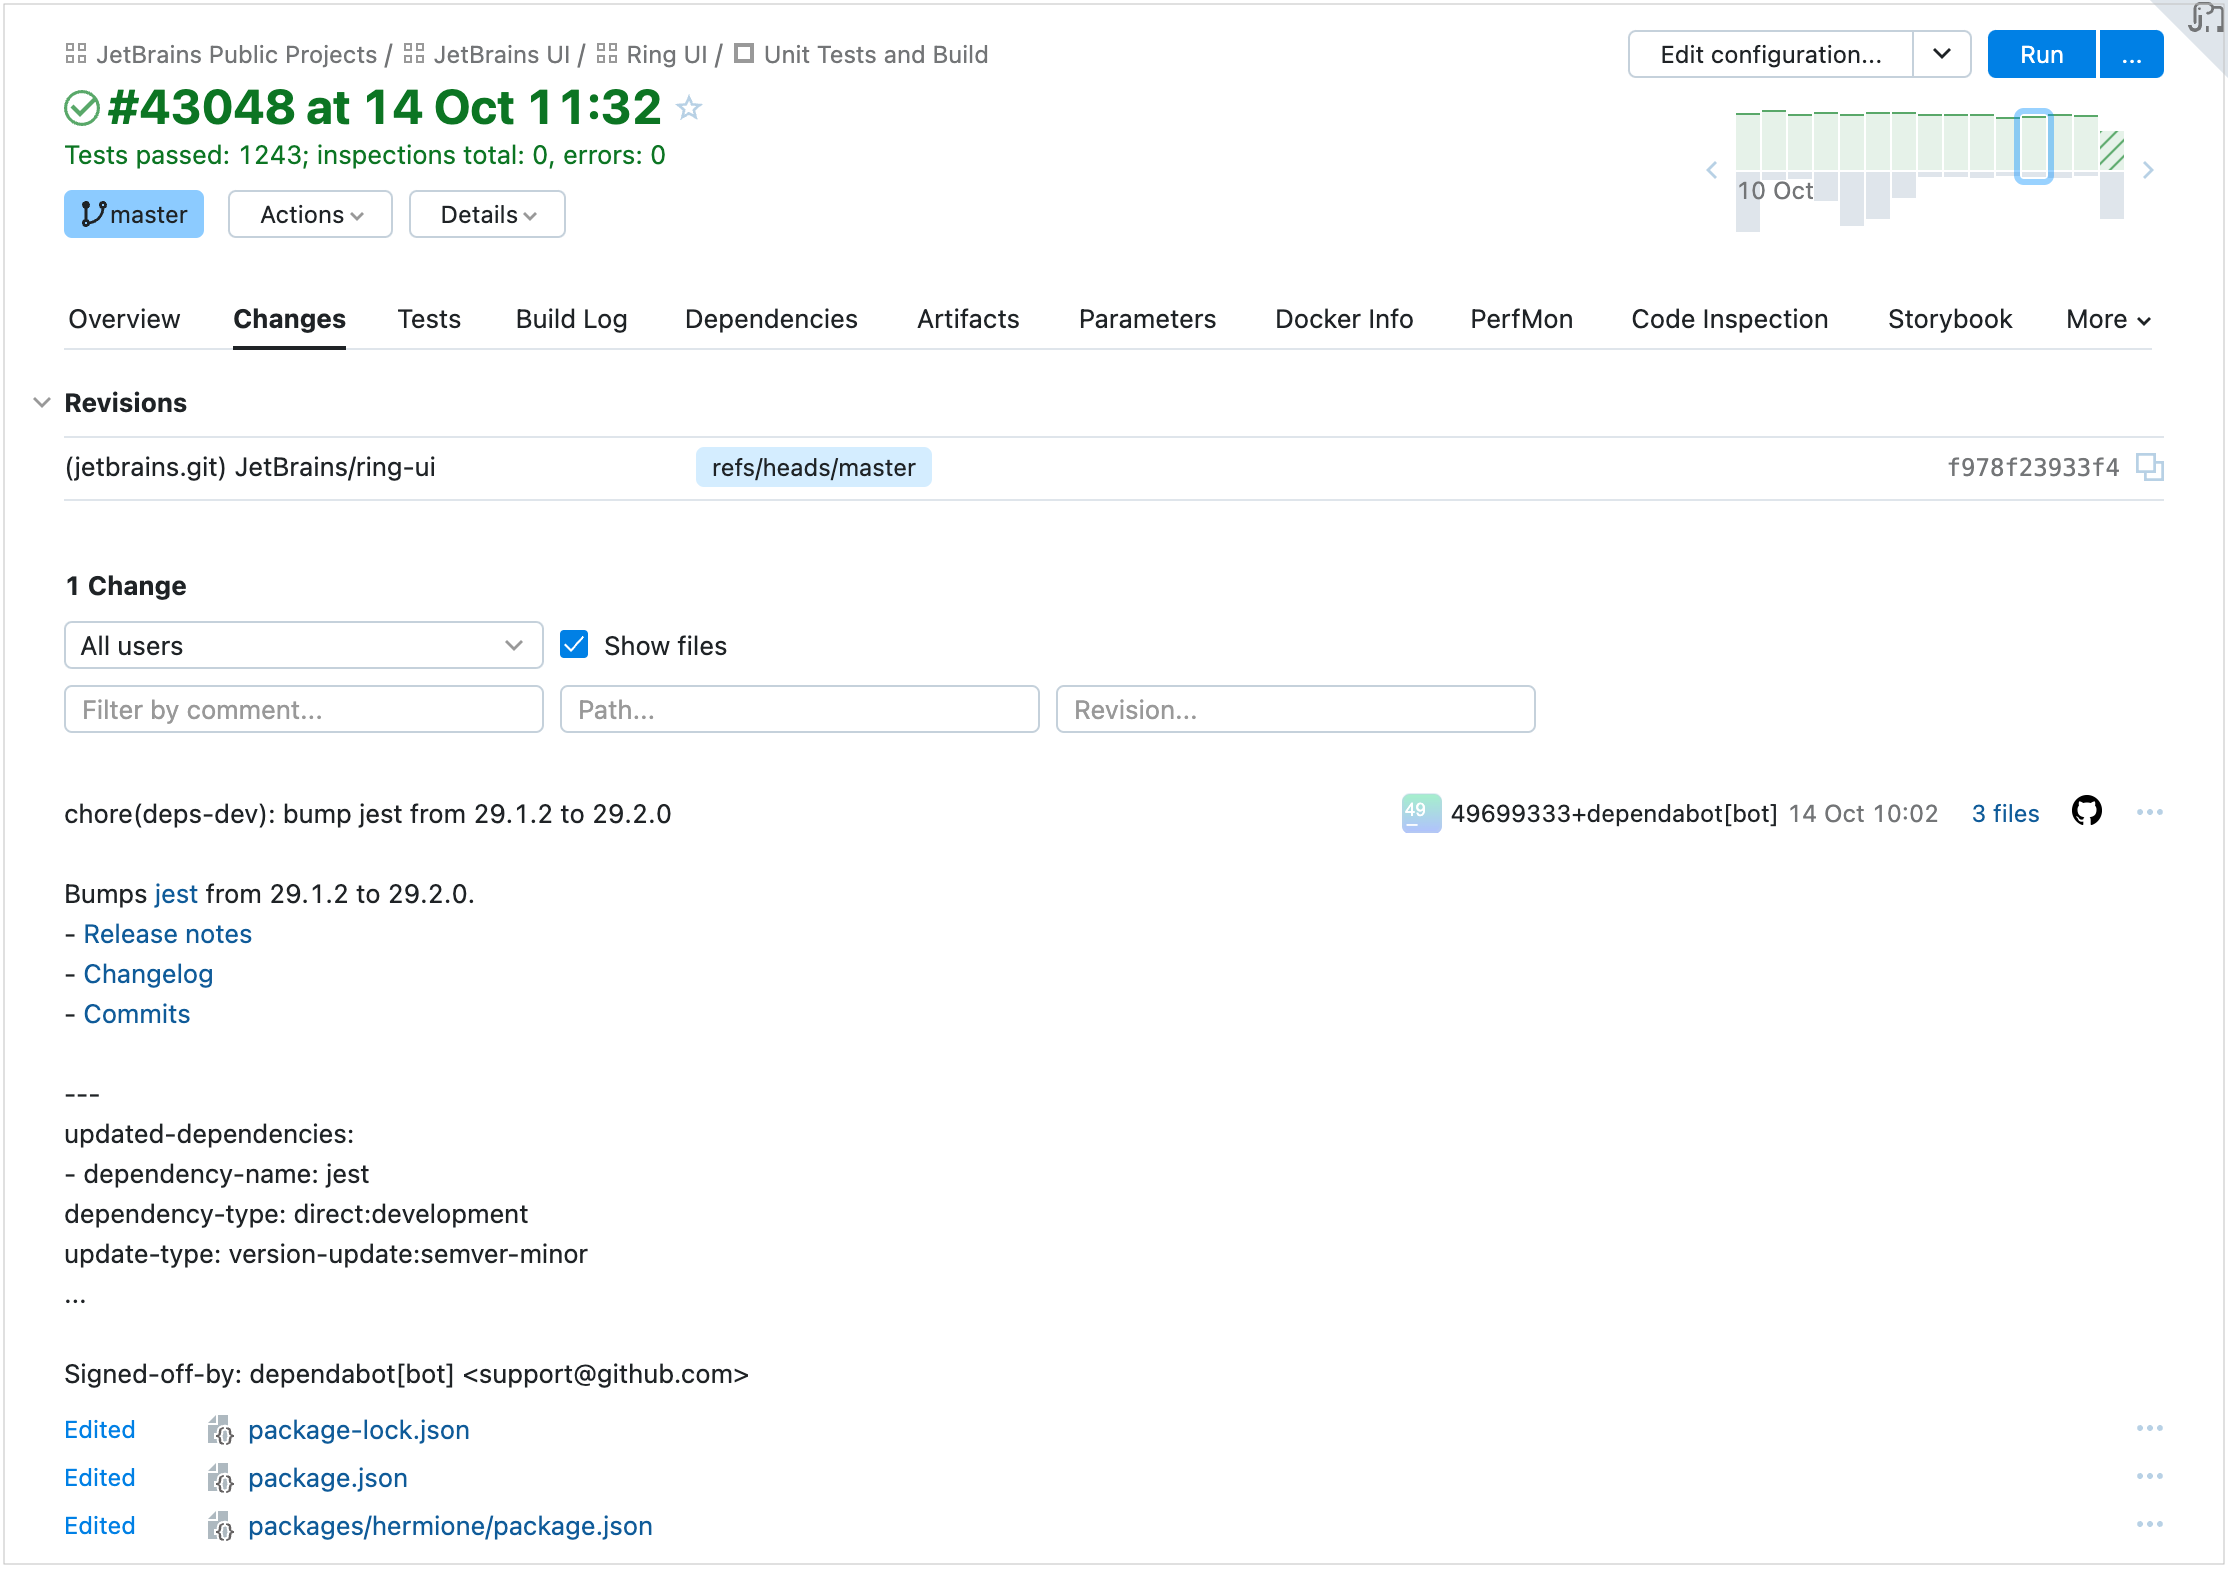
The Changes tab displays more information about the changes in the build, separately for user commits and artifact changes. You can filter changes by their author and display changes made in the build configuration settings.
The Tests tab allows switching between failed, ignored, and succeeded tests. Click a test to quickly view its details or, for example, to assign an investigation. You can also view its history on the new Test History page.
The Test History page has better performance now. It also has an adjustable range slider allowing you to select a period of the test history that will be displayed below. The tests timeline is interactive:
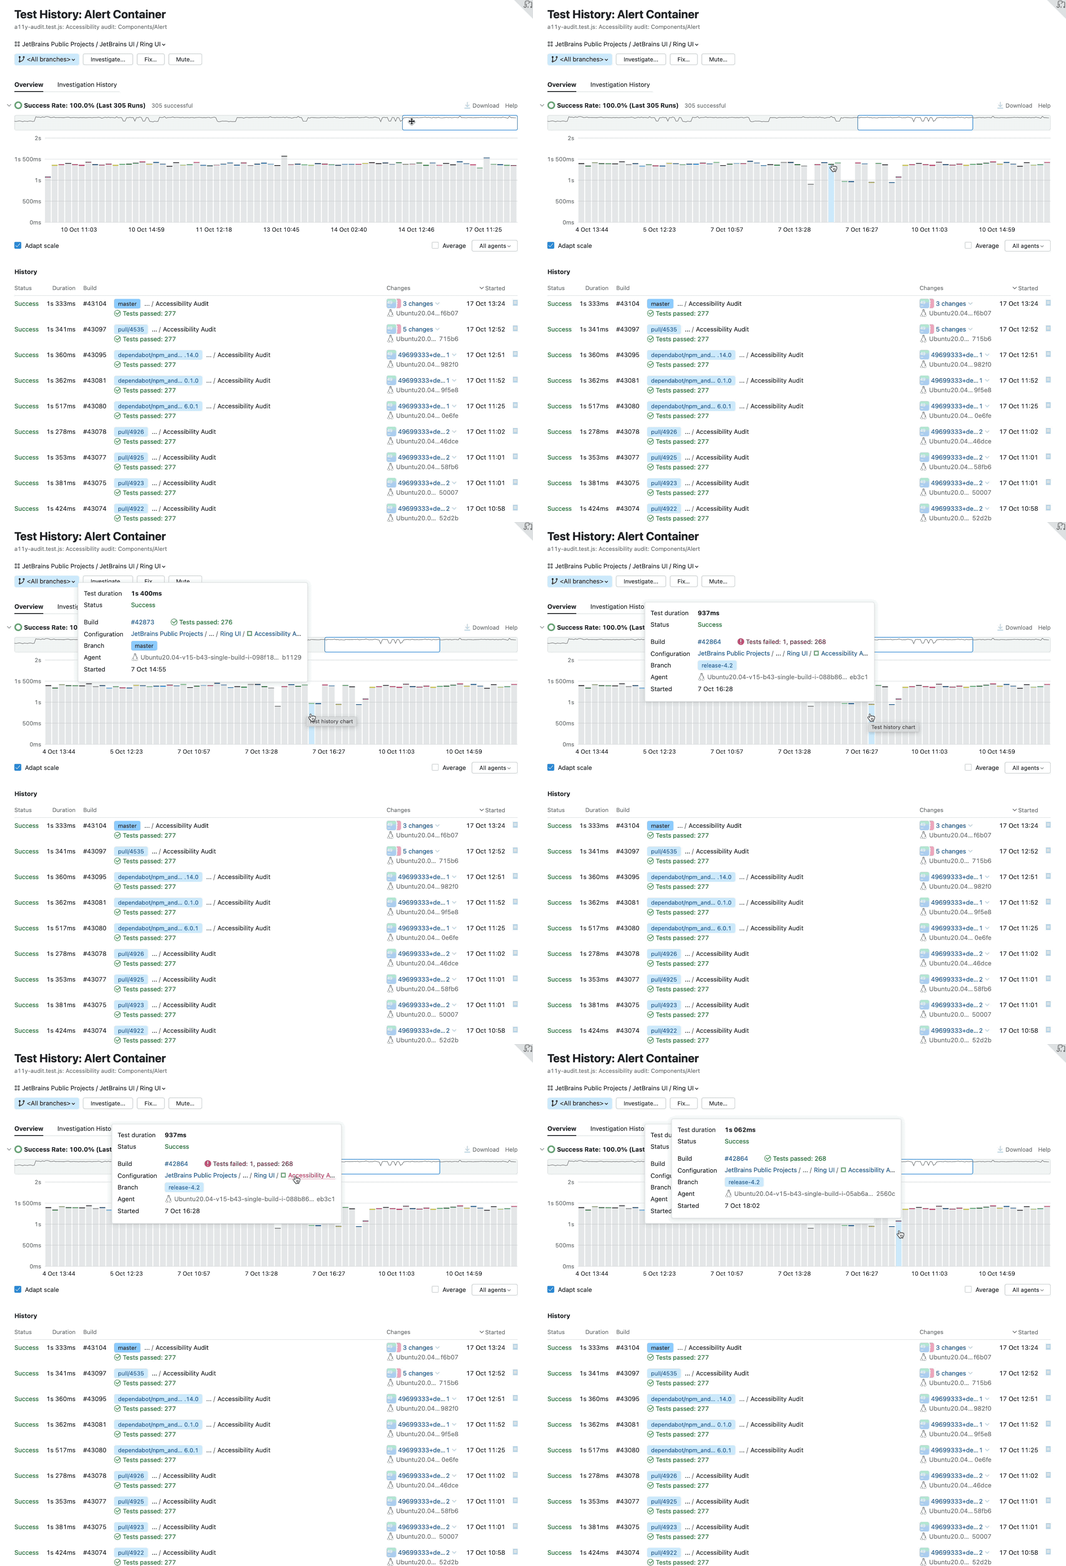
The list of builds that ran this test has improved usability now: on clicking a build, the stacktrace is displayed.
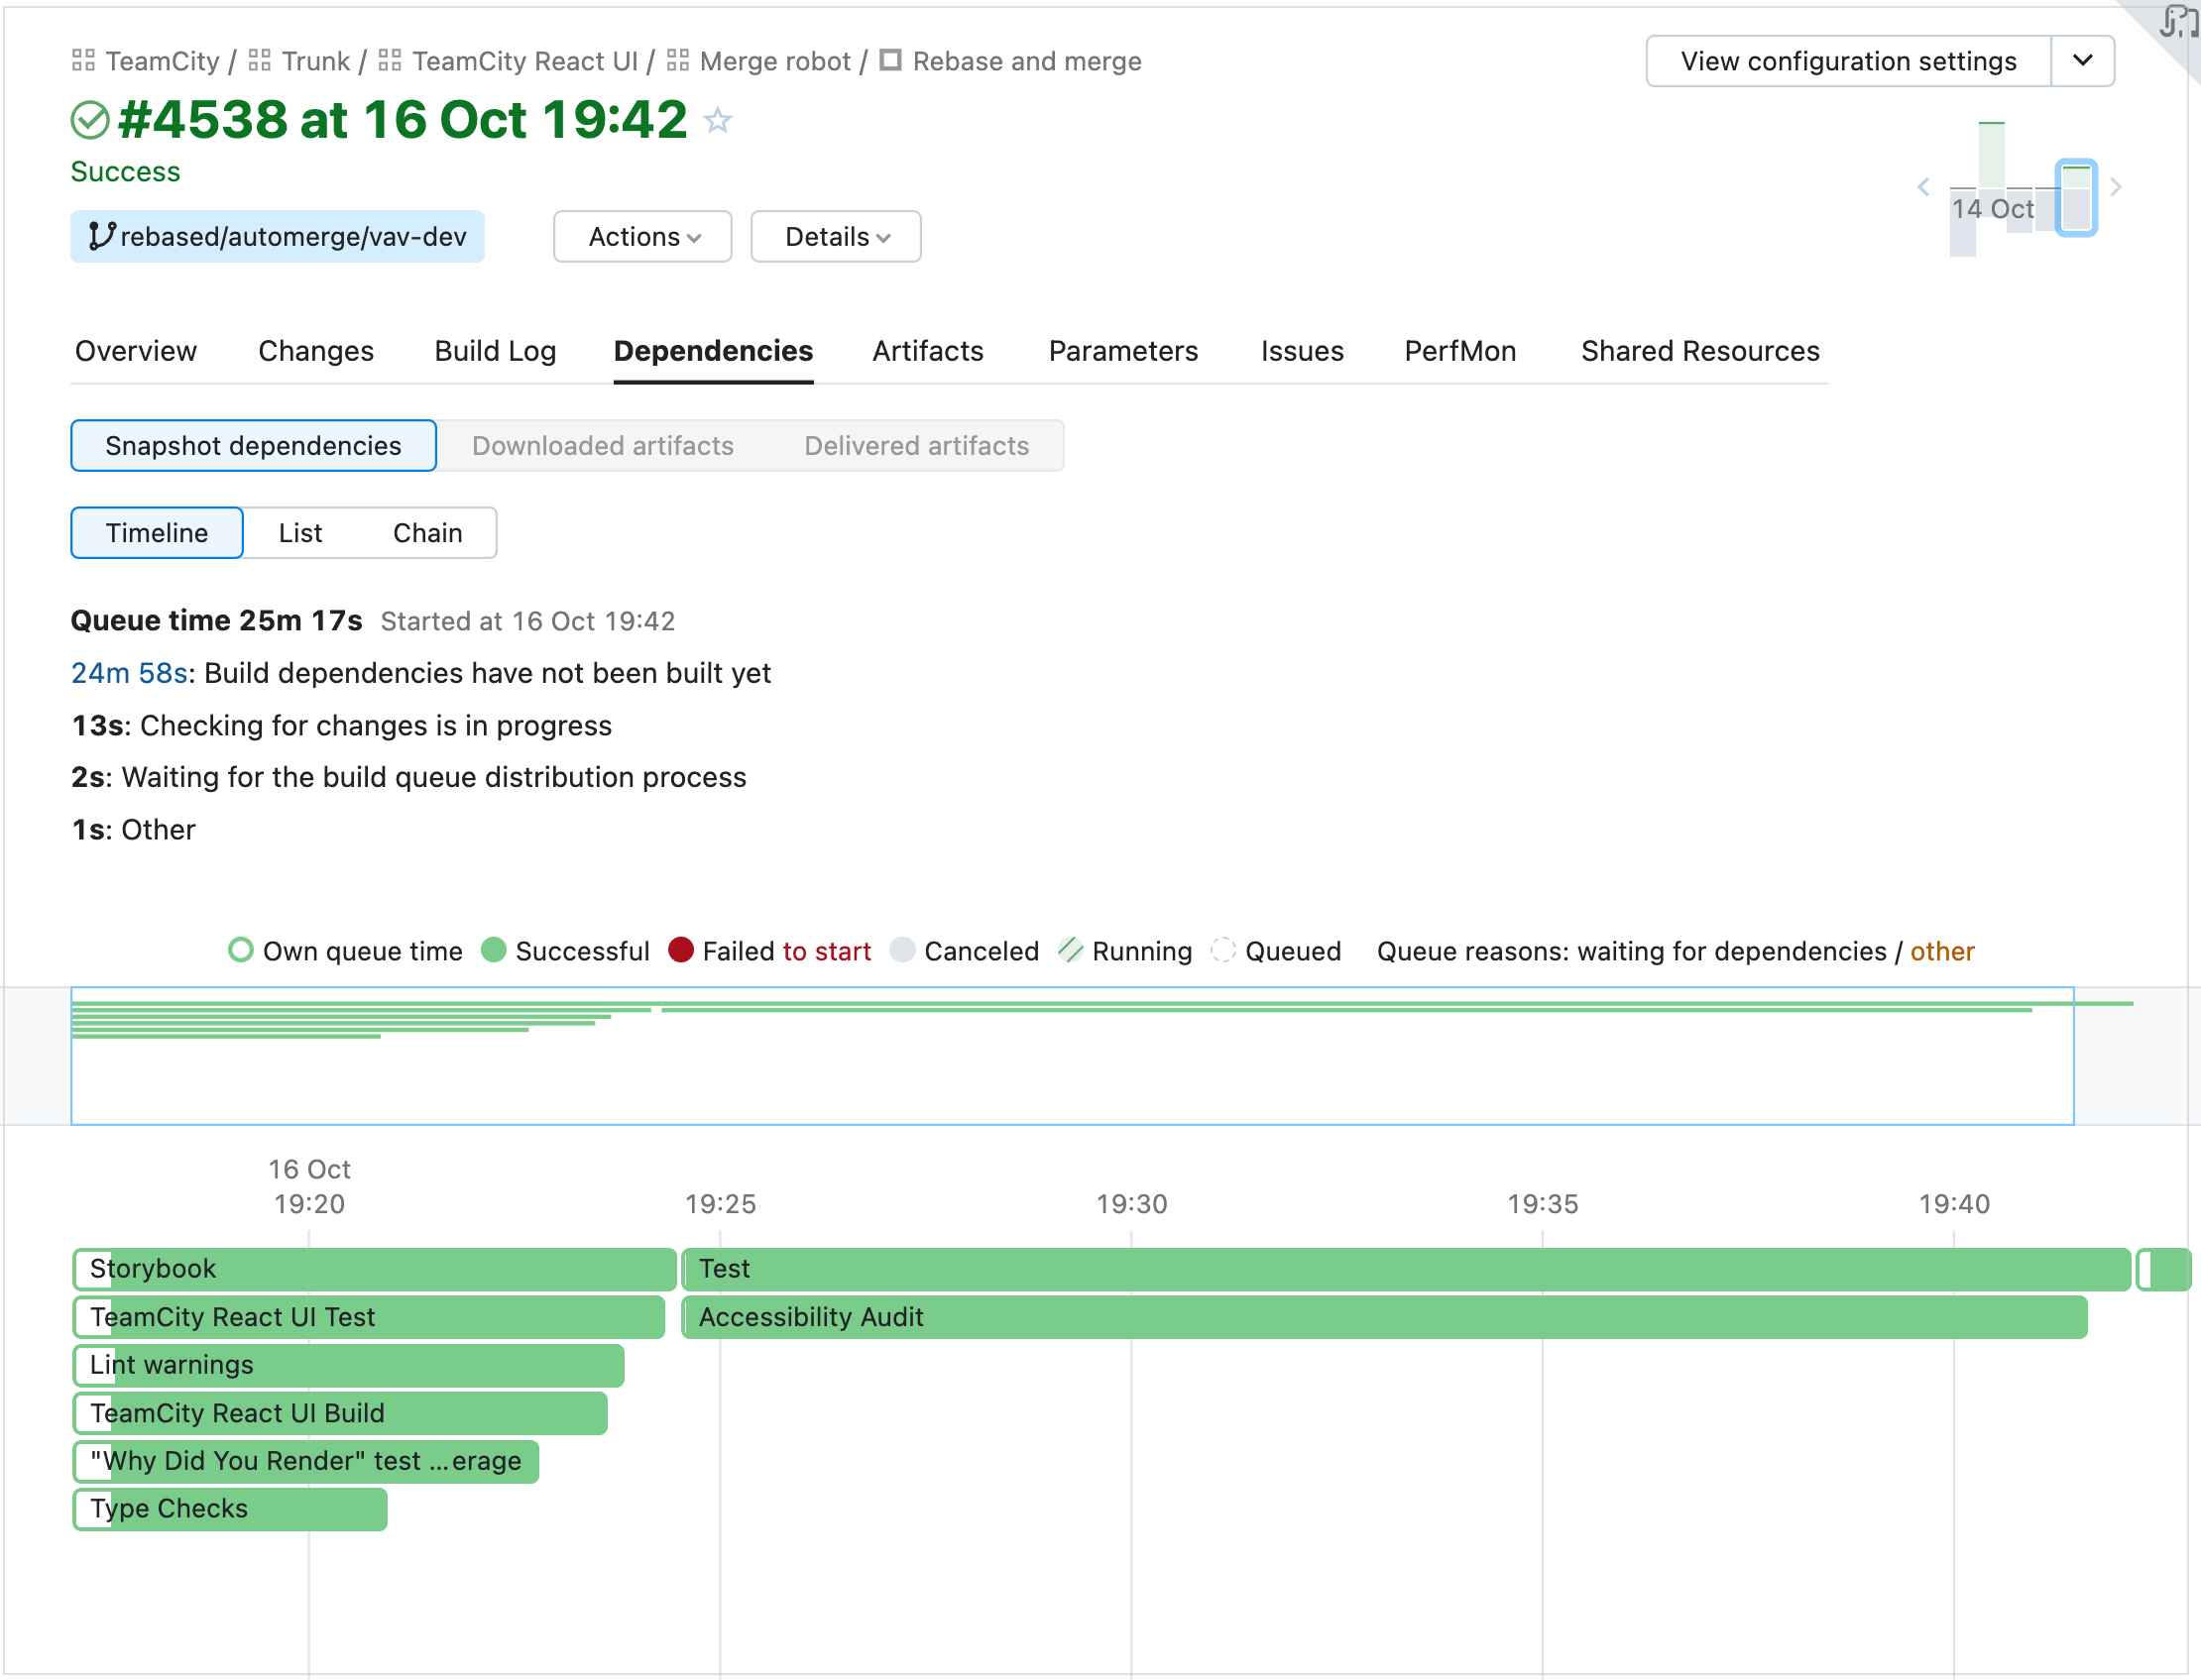
The Dependencies tab boasts of a new more user-friendly design.
It provides three alternative modes of displaying the build dependencies: a visual timeline, structured list, and build chain. Choose the mode that is the most helpful for your current task.
The interactive timeline shows the sequence of builds and the duration of each build in this pipeline. It has an adjustable range slider allowing you to select a build of the pipeline.
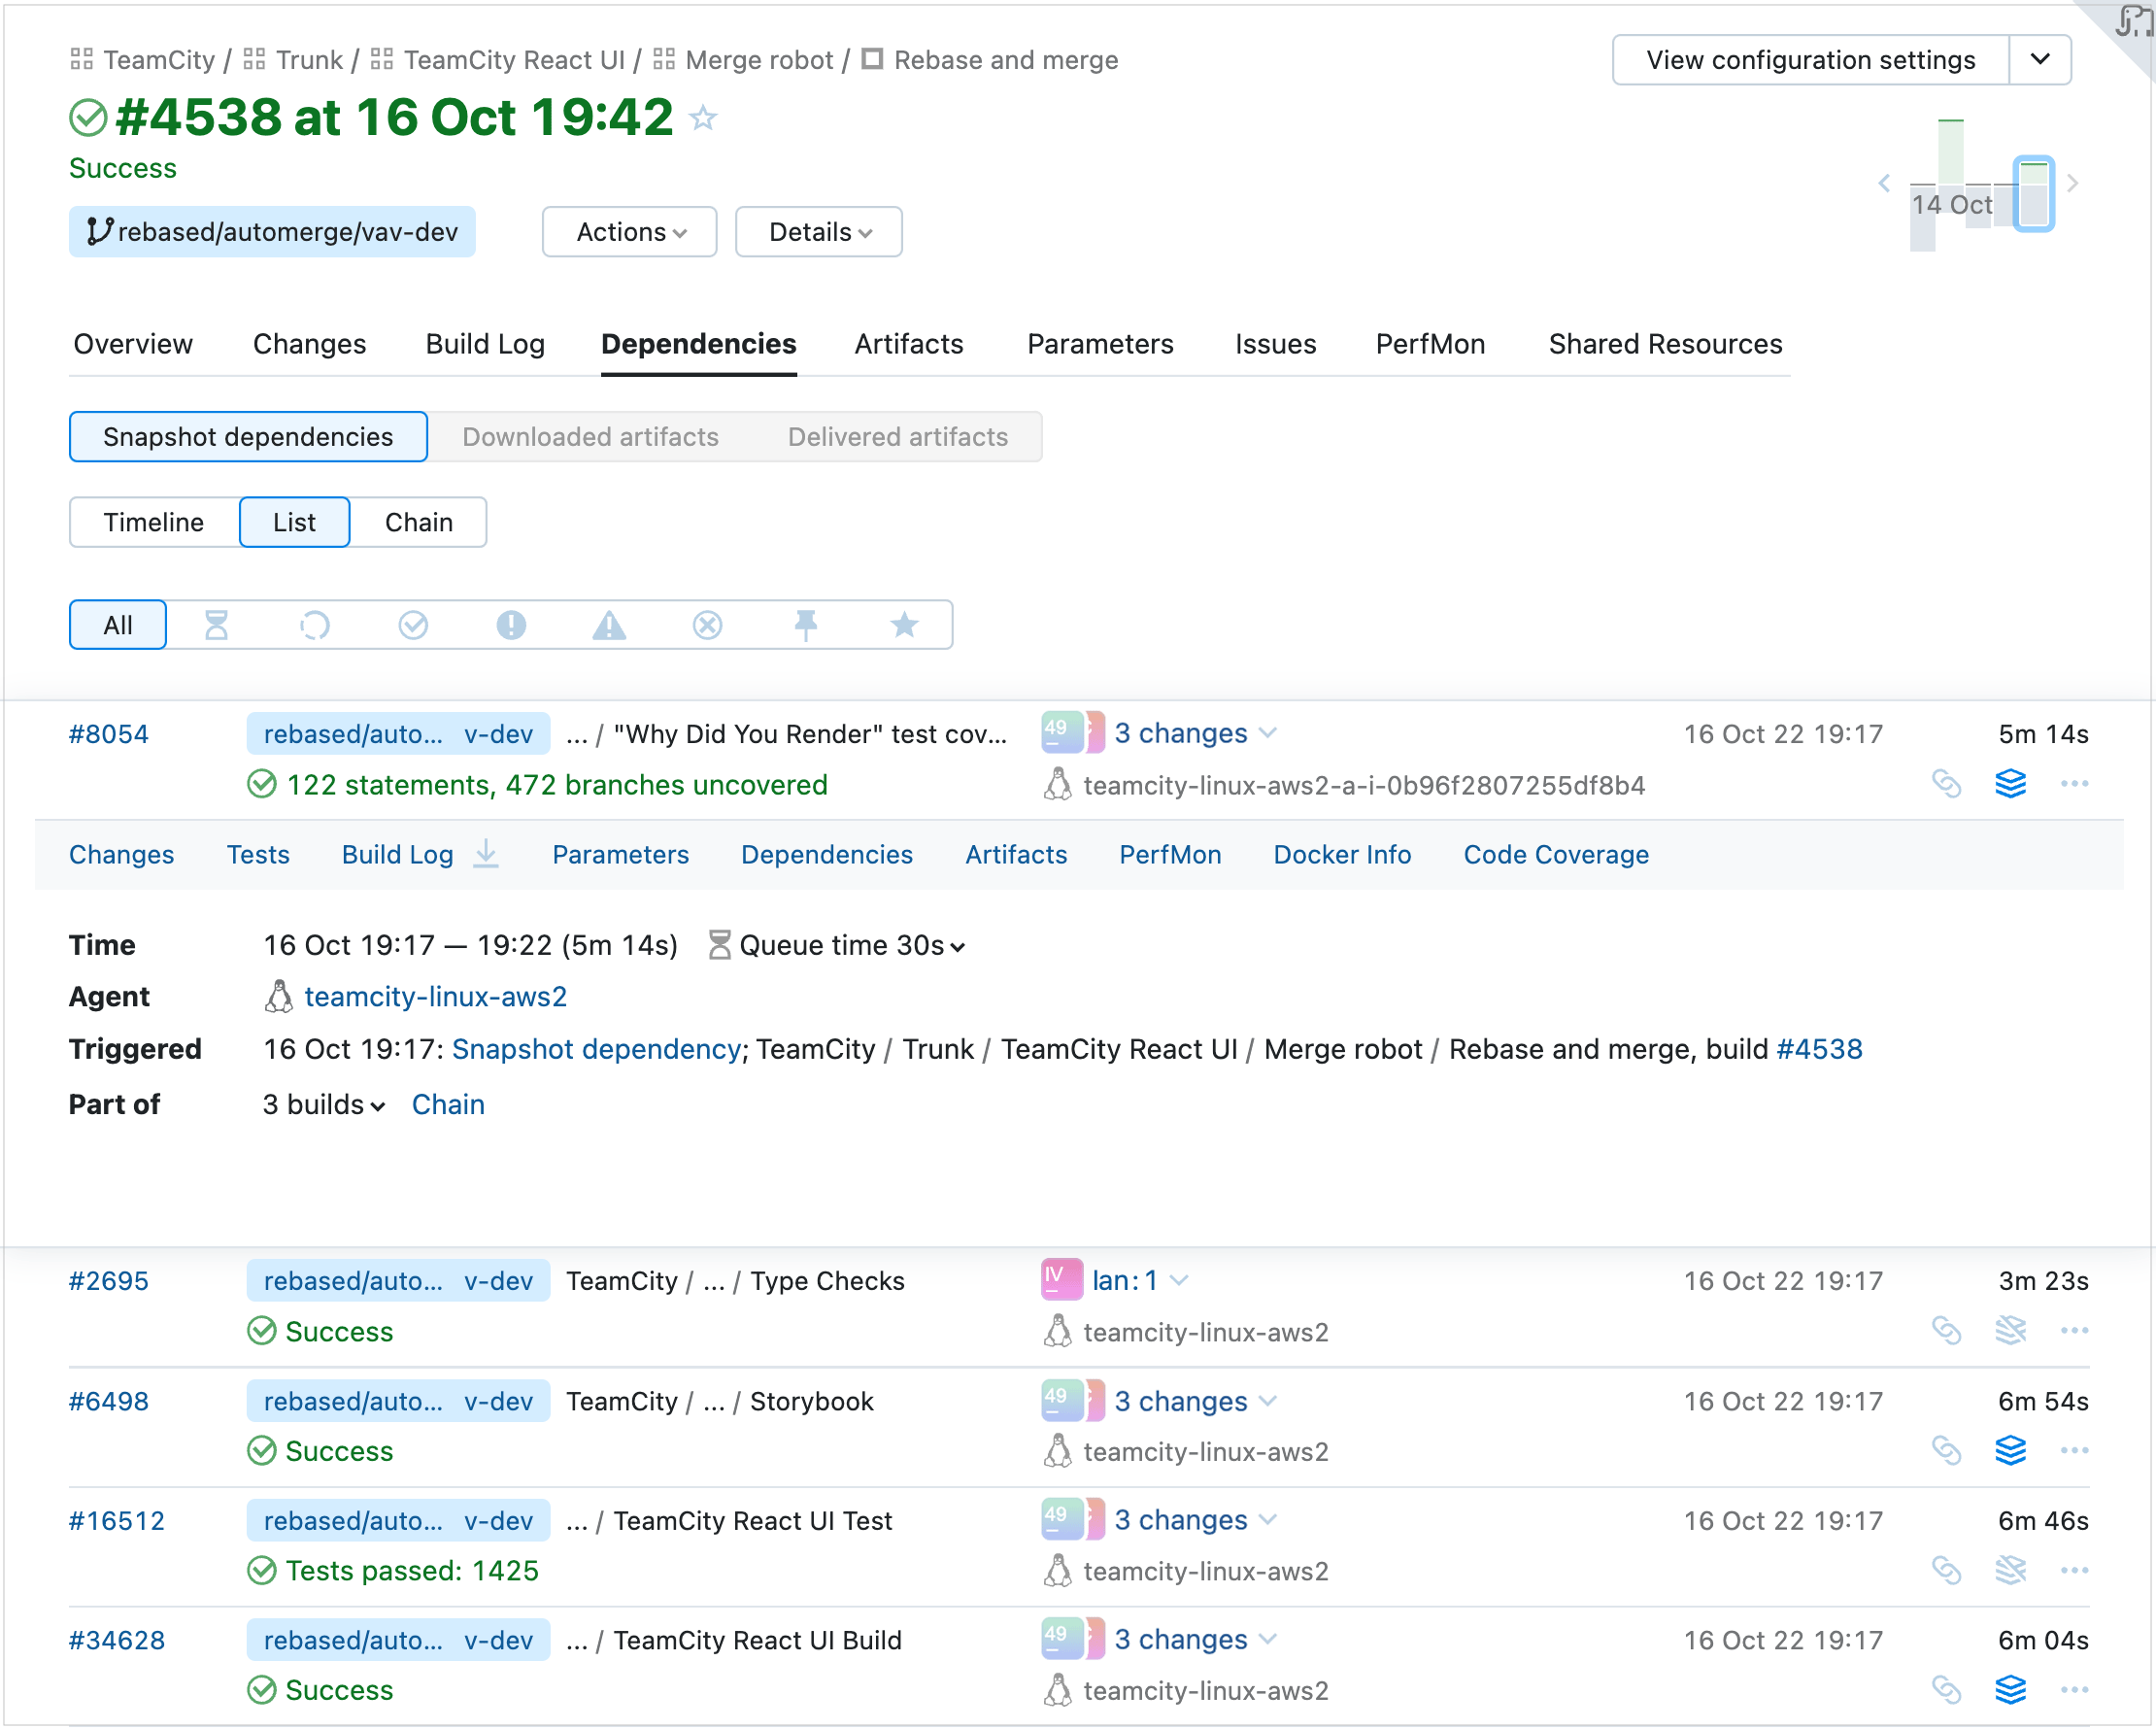
The list is a flat line of the builds, which also has a lot of interactive features: you can click and expand a build line and review the results.
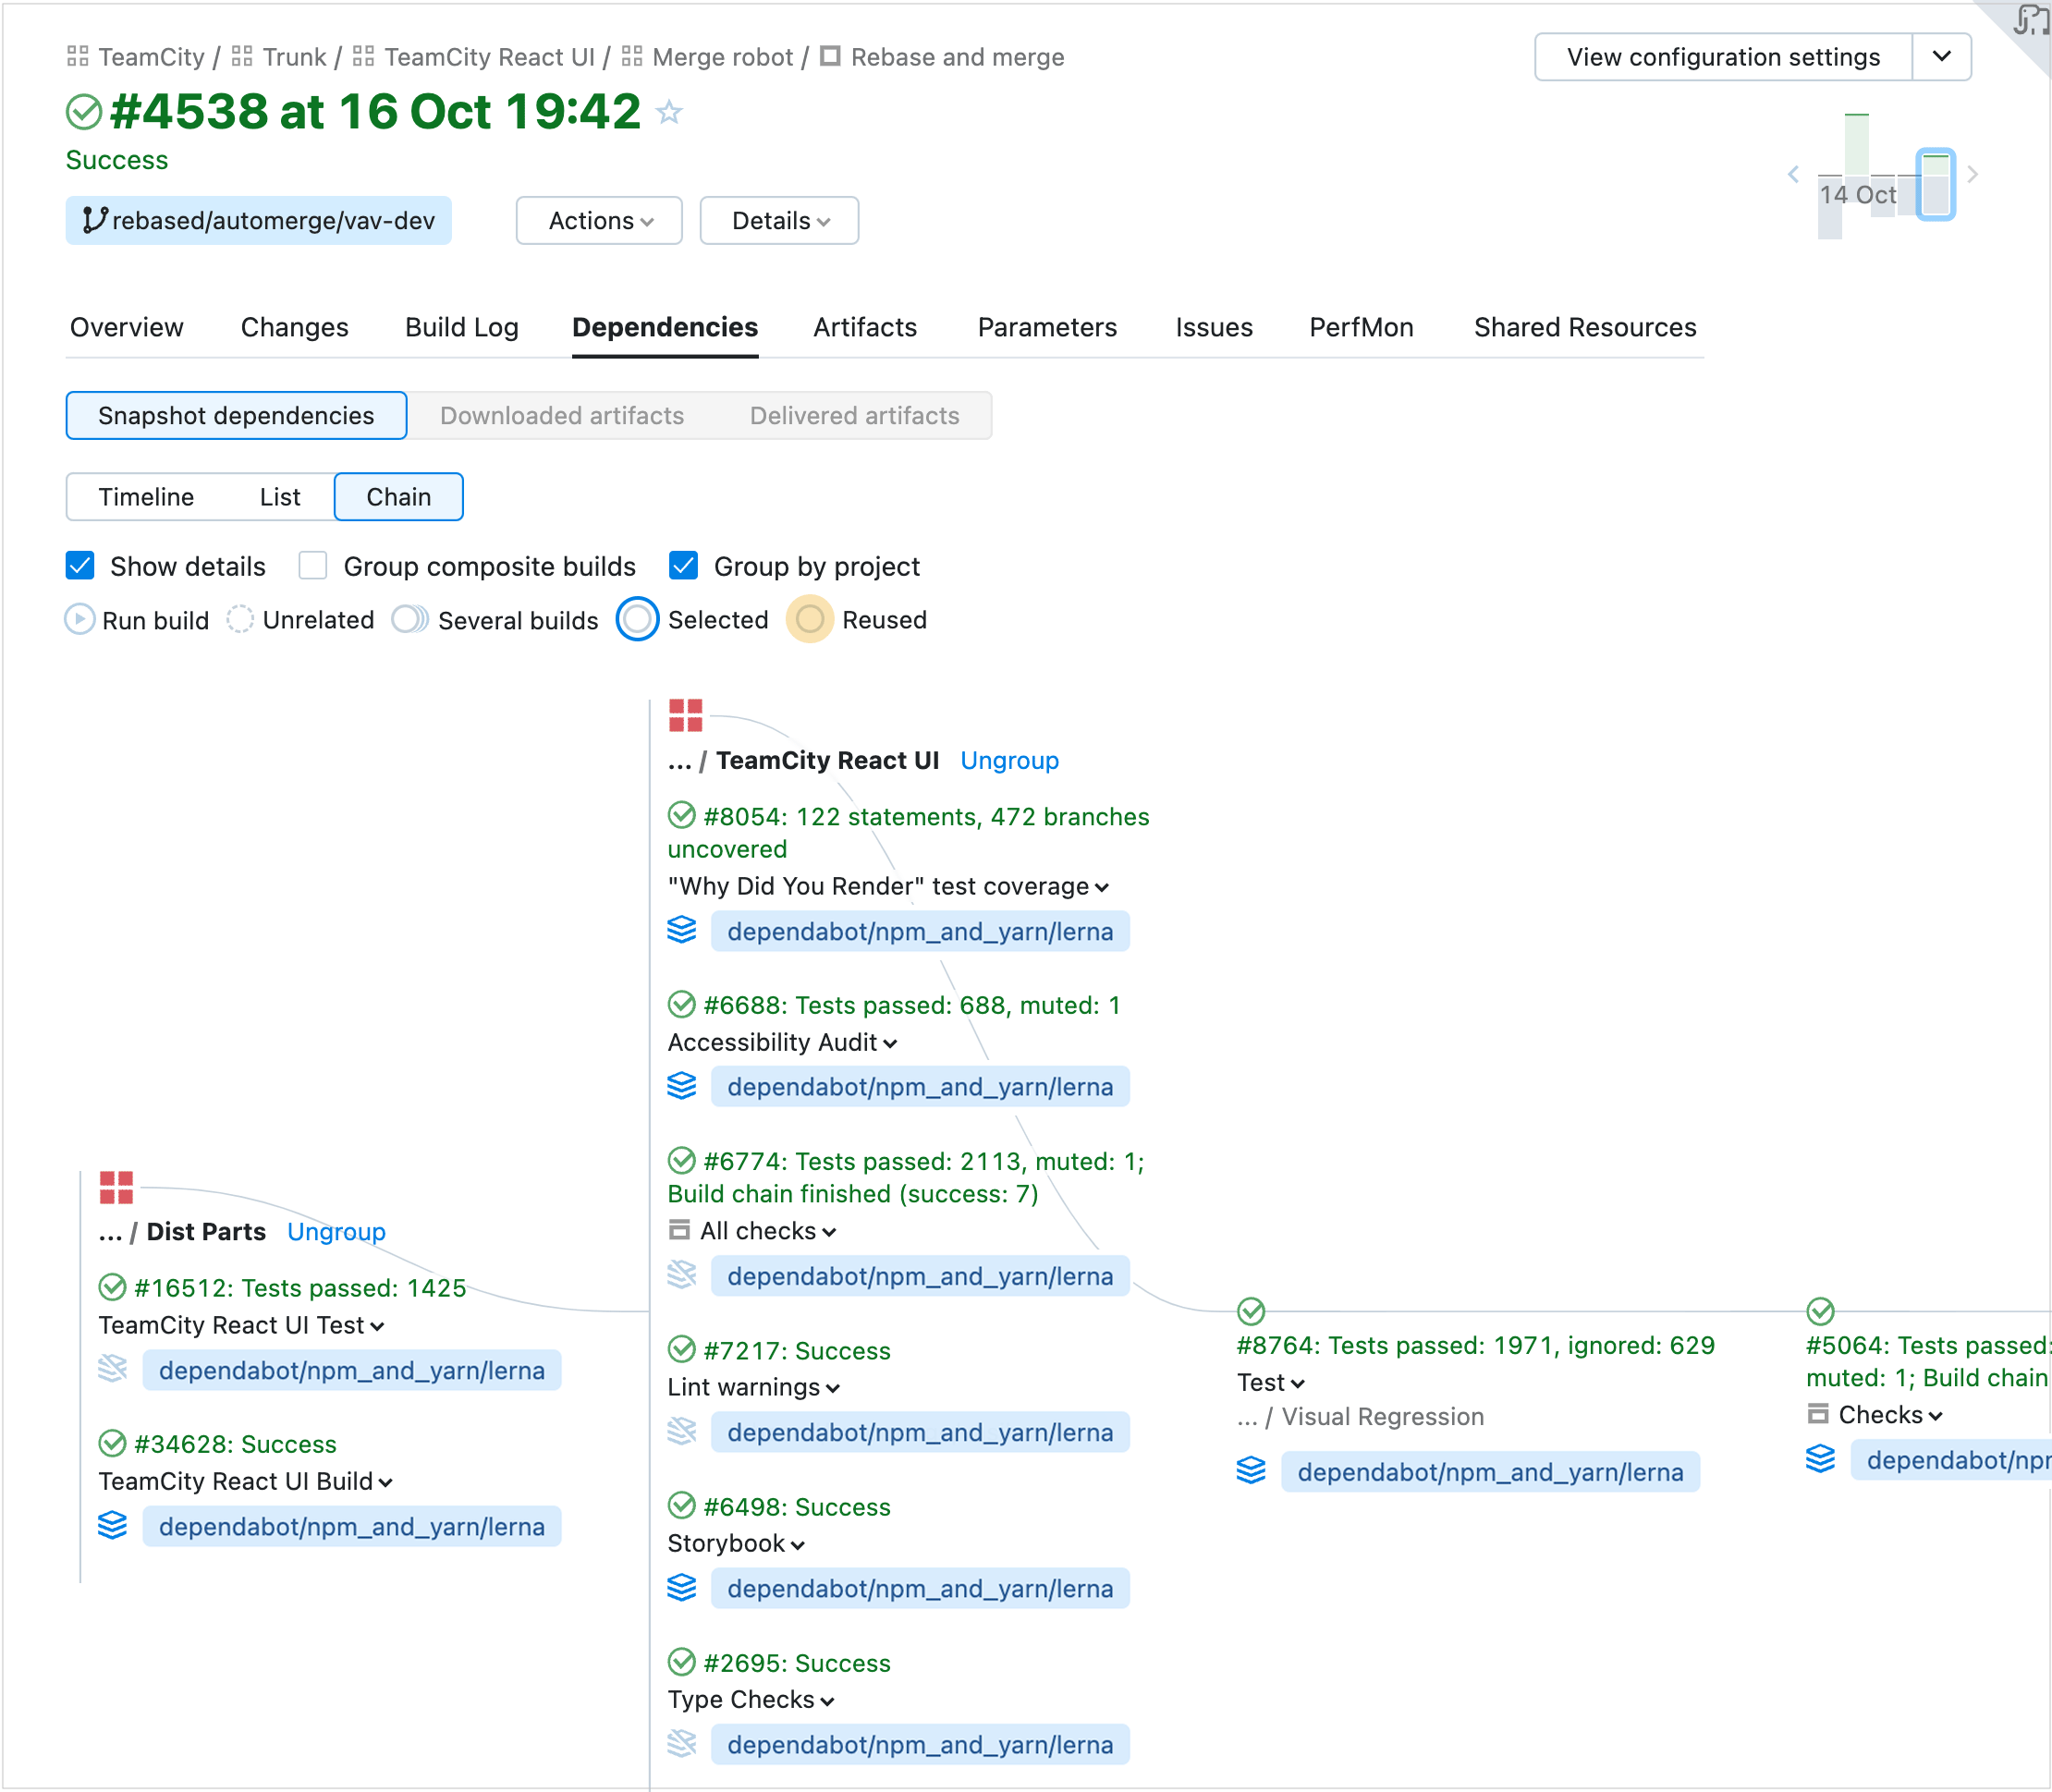
The chain page loads faster and demonstrates build dependencies more clearly.
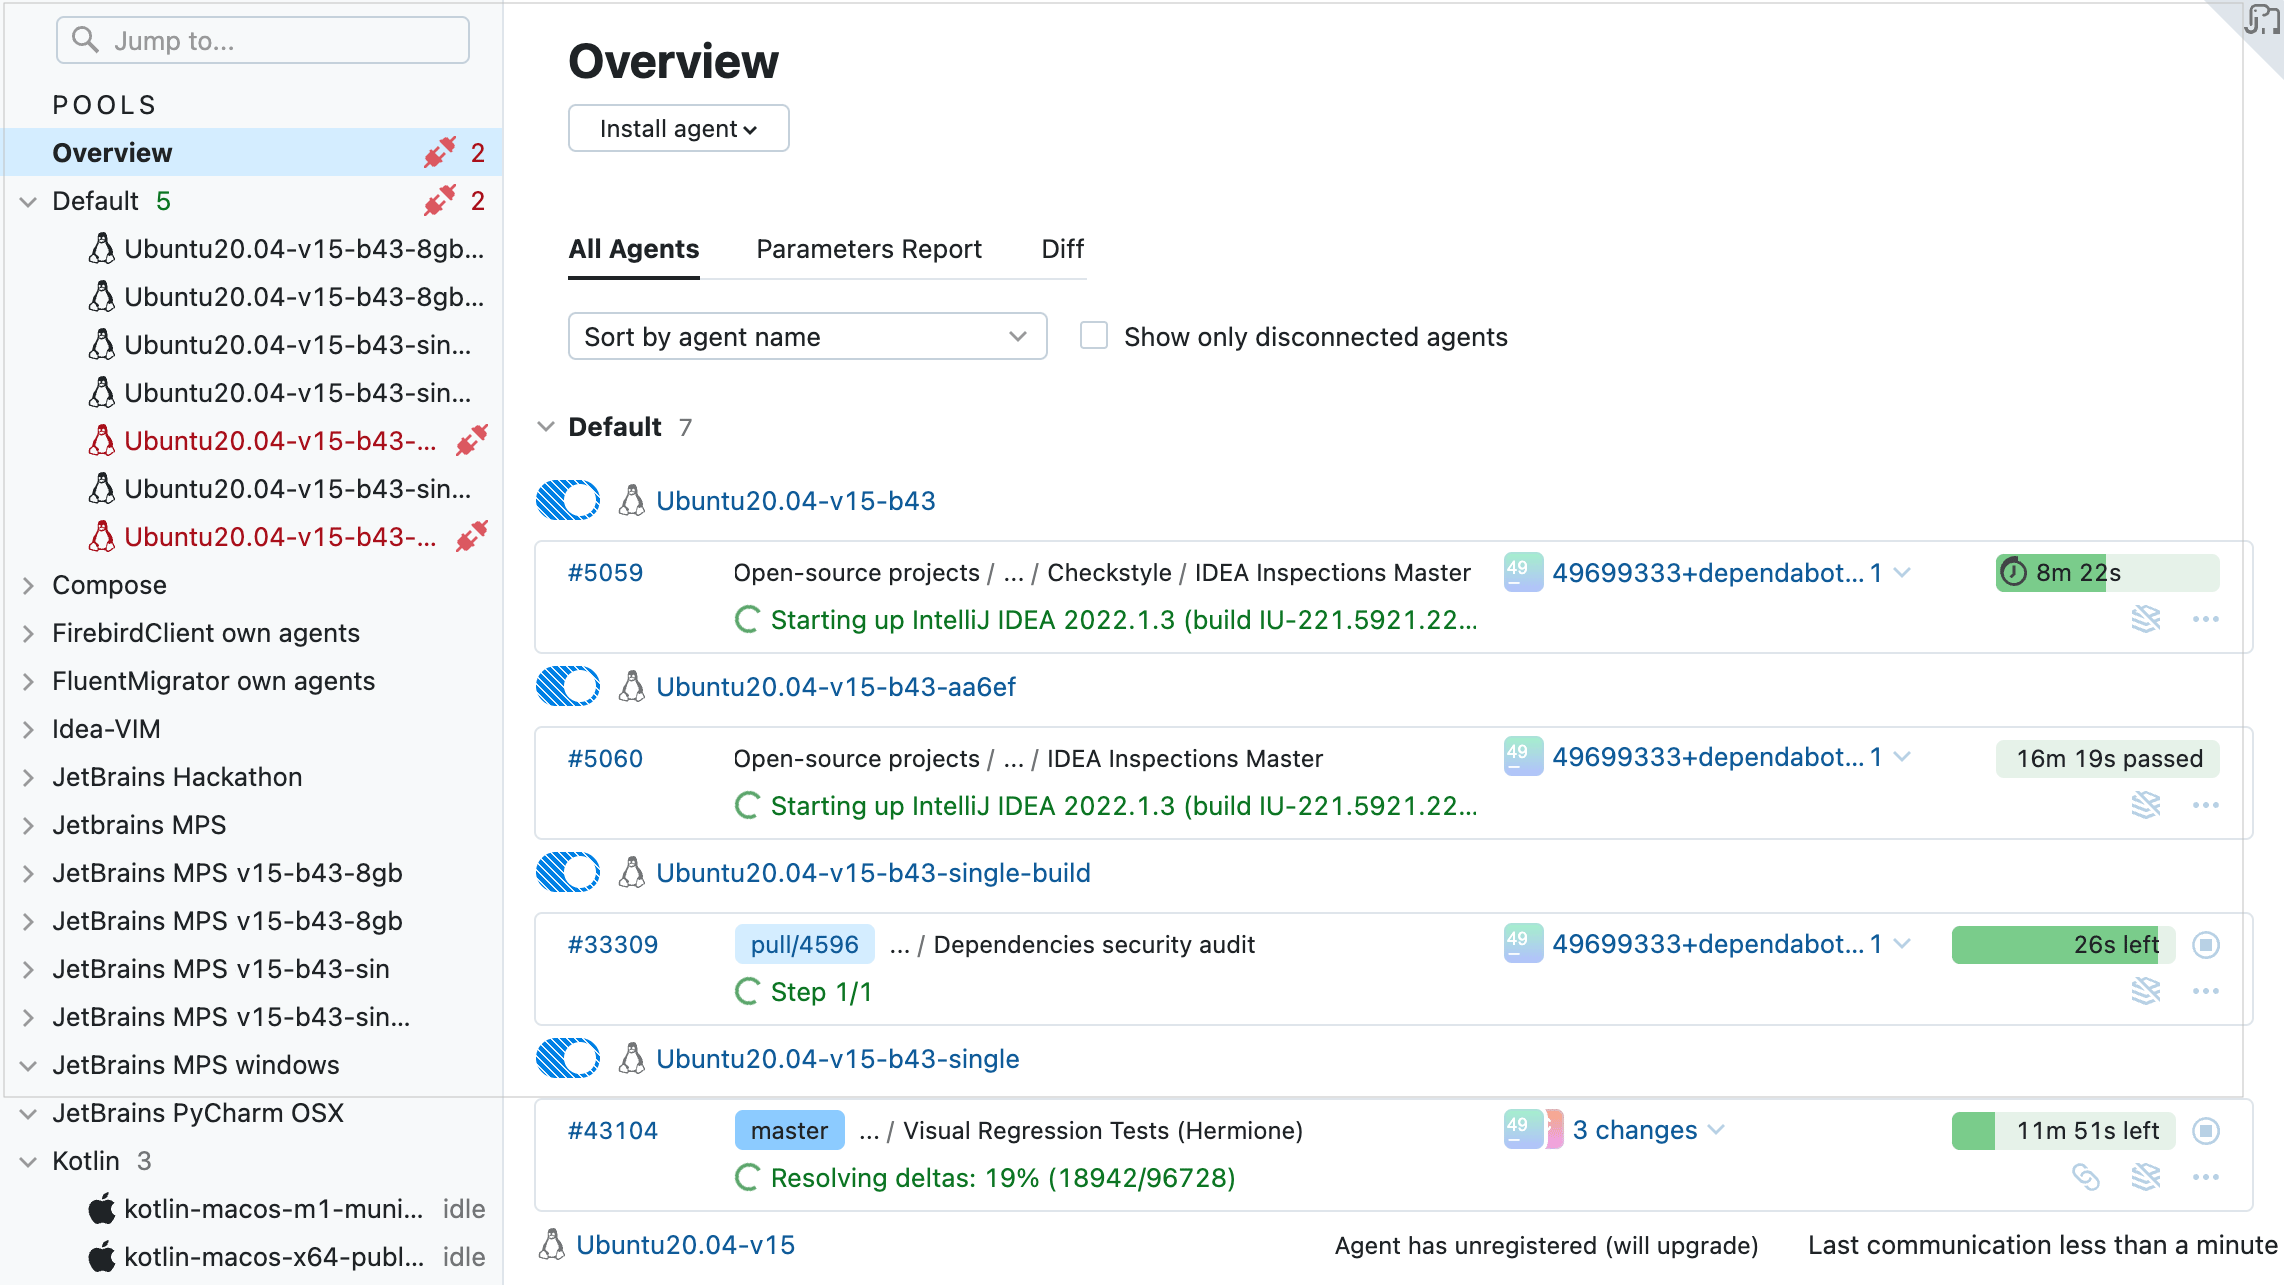
The Sakura Agents page loads faster for a large number of agents and allows switching between agent details quickly.
The page provides a better hierarchical view of agent pools and makes it easier to see all their assigned projects and cloud images.
The All Agents view gives a quick preview of all agents' statuses and allows managing them side by side, on a single dashboard.
You can edit the scope of agent pools and quickly assign agents and projects to them.
To edit an agent pool, click Assign agents in its settings. In this dialog, you can choose what agents you want to assign to the pool:
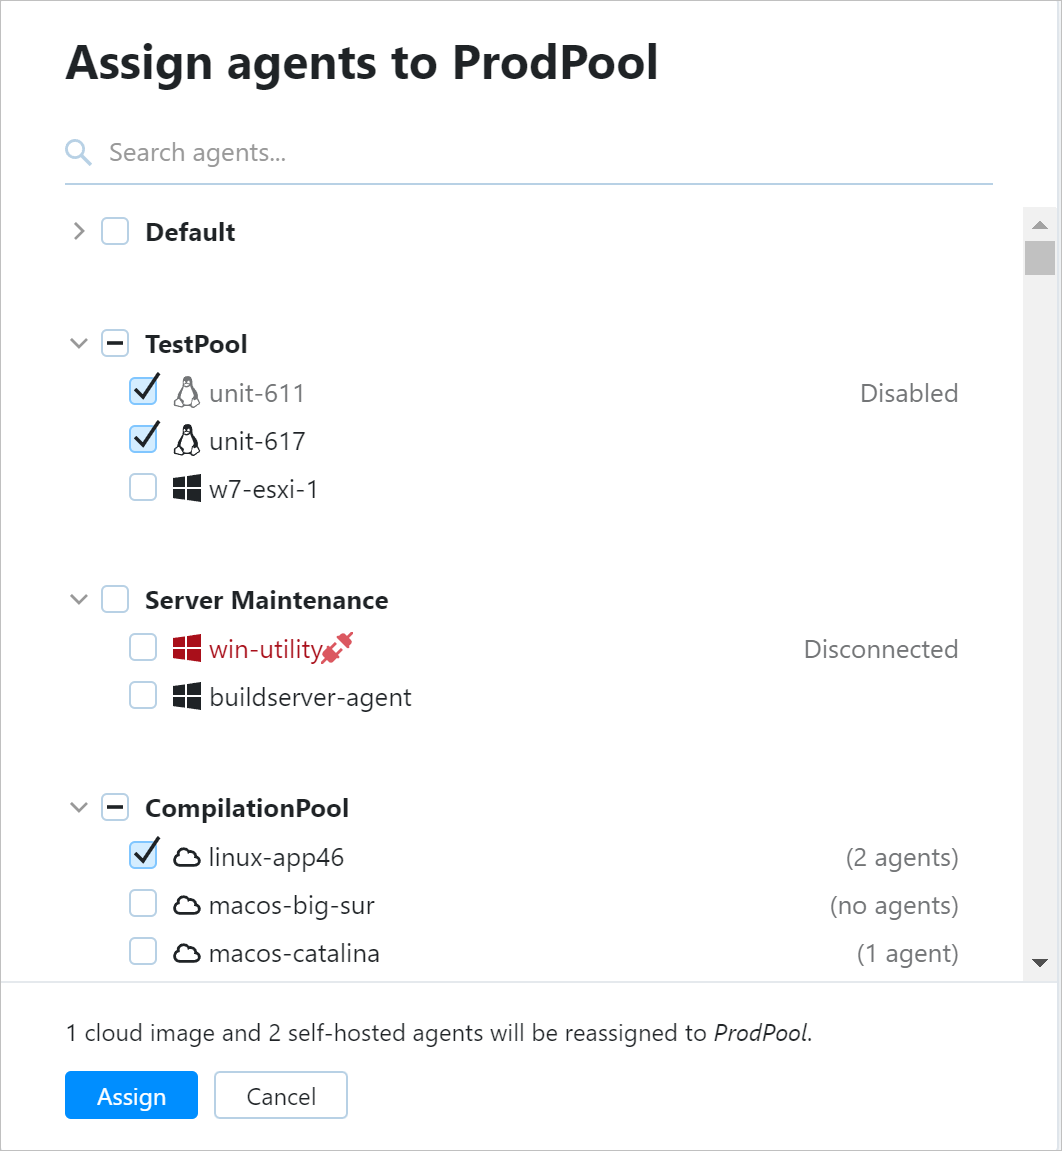
Note that whenever you select a cloud image, you actually assign all its instances to the pool. If this pool has a limit of agent slots, each cloud instance will take a single slot, just like any regular agent.
Similarly, you can also associate projects with this pool: open the Projects tab of the pool's settings and click Assign projects. This way, agents assigned to this pool will be allowed to run builds only in the selected projects.
The Agents sidebar allows browsing the agent pool hierarchy including cloud profiles and searching agents and pools by name. The Overview view provides statistics about all the agents on the server.
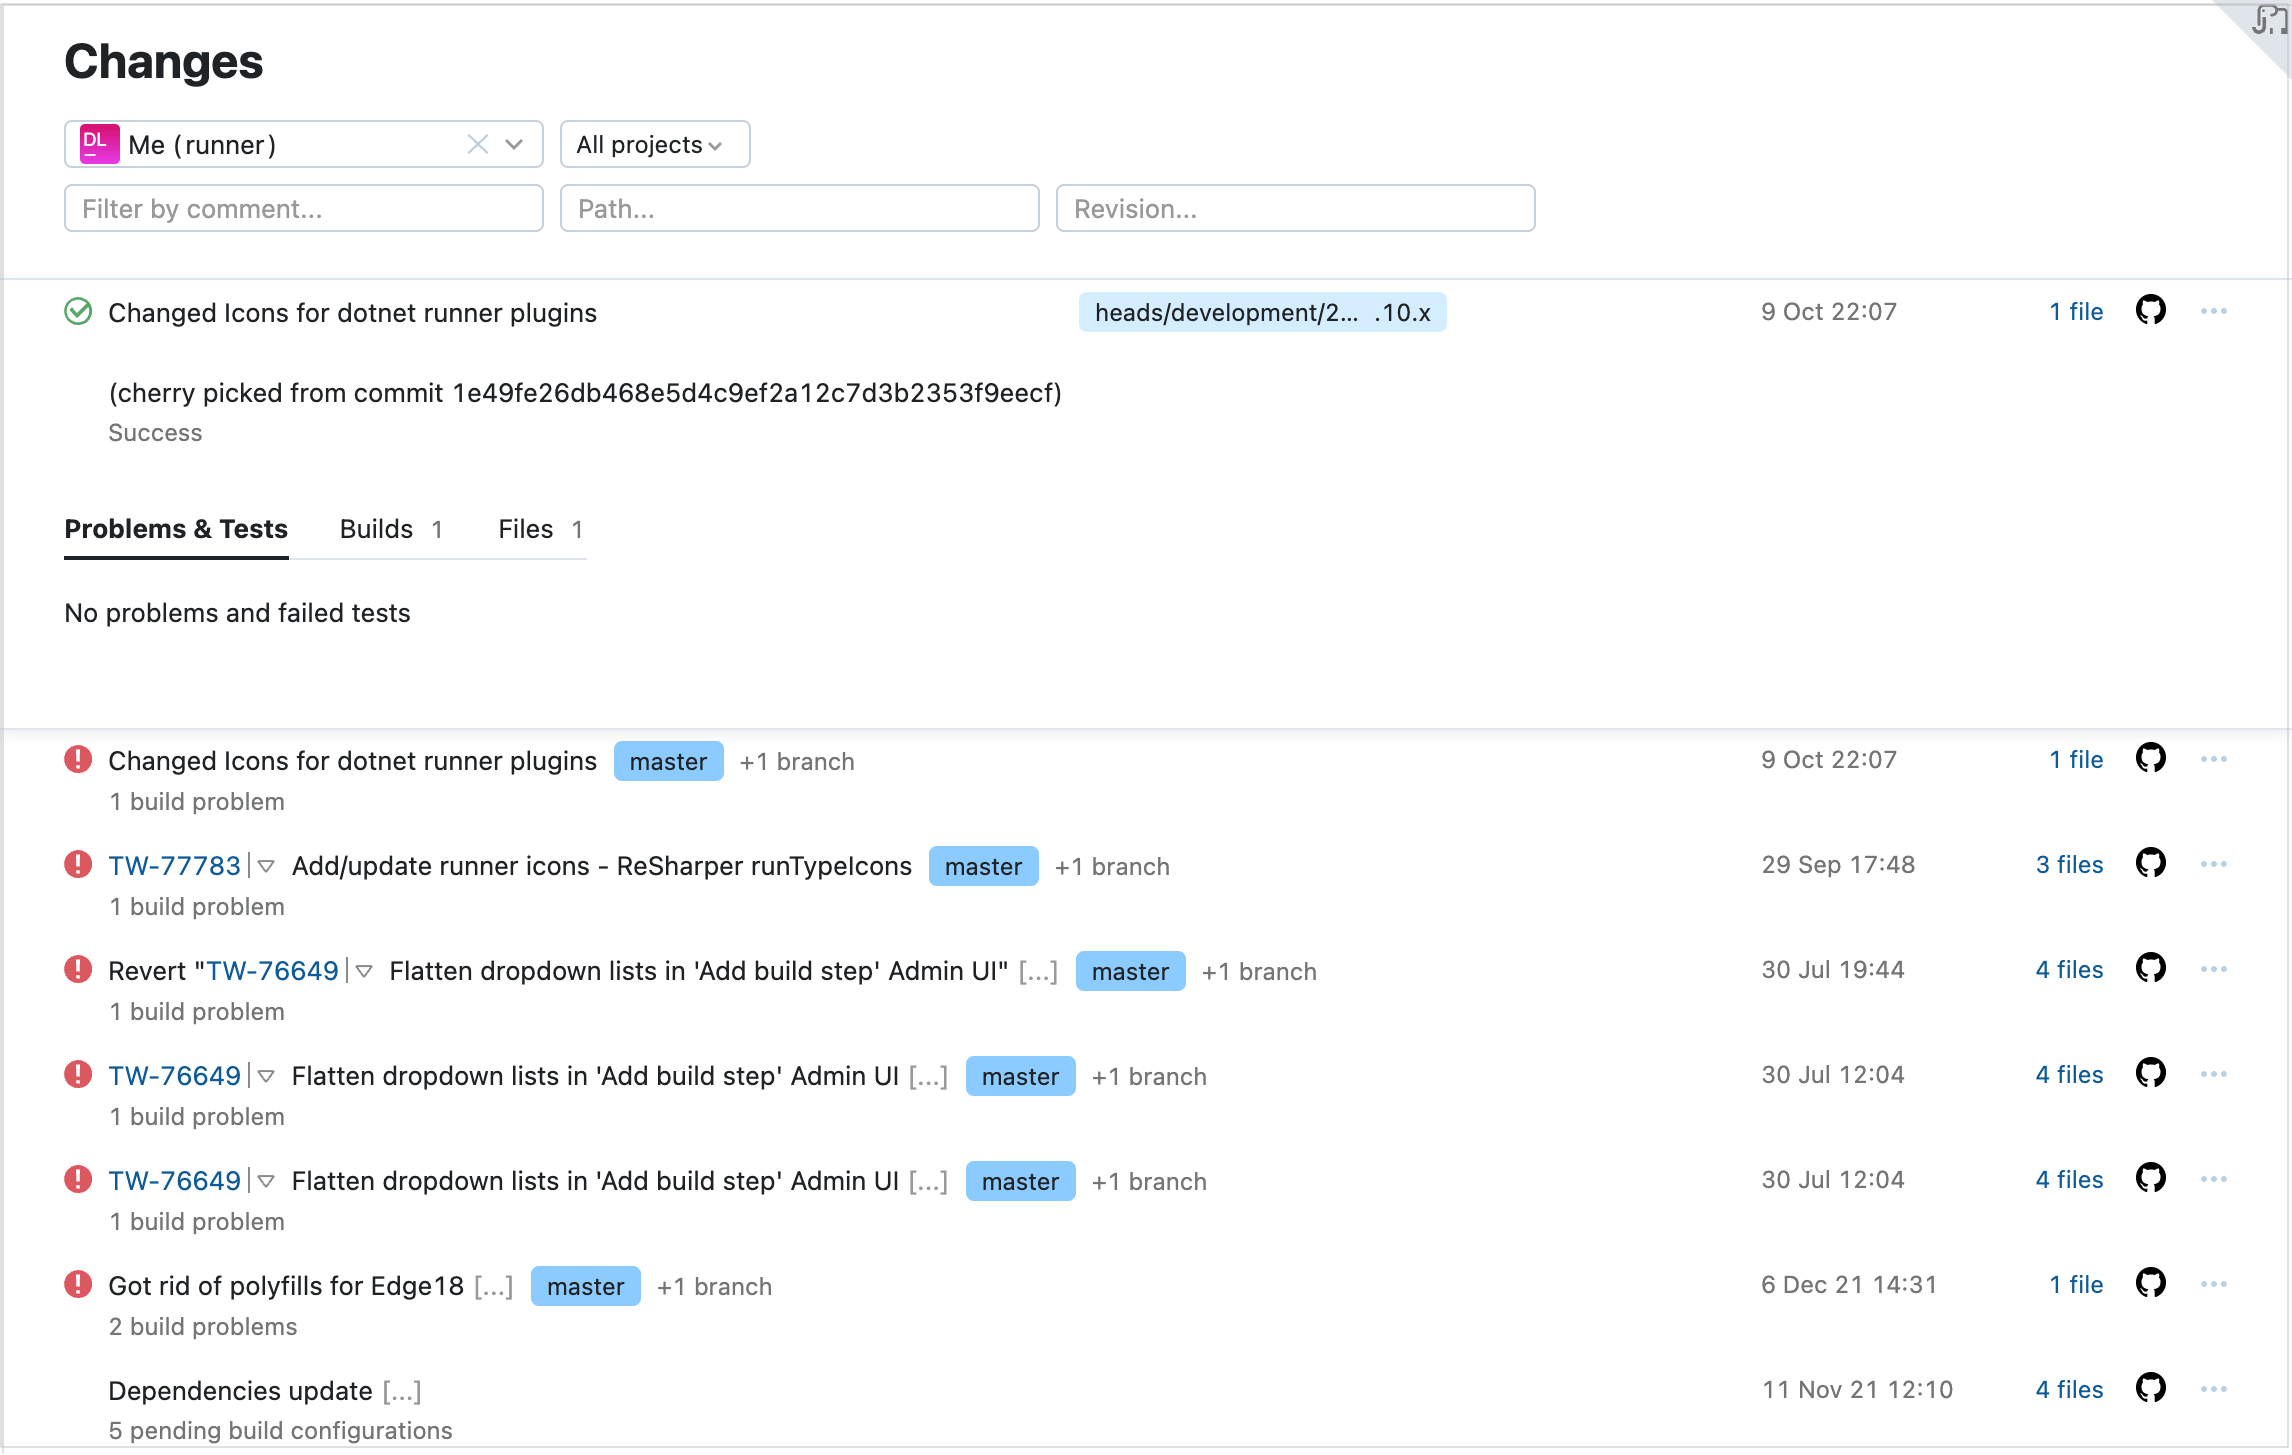
The Sakura Changes page comes with filters providing flexible search options allowing you to sort changes by comment (commit message), by path to the changed file, and by revision number.
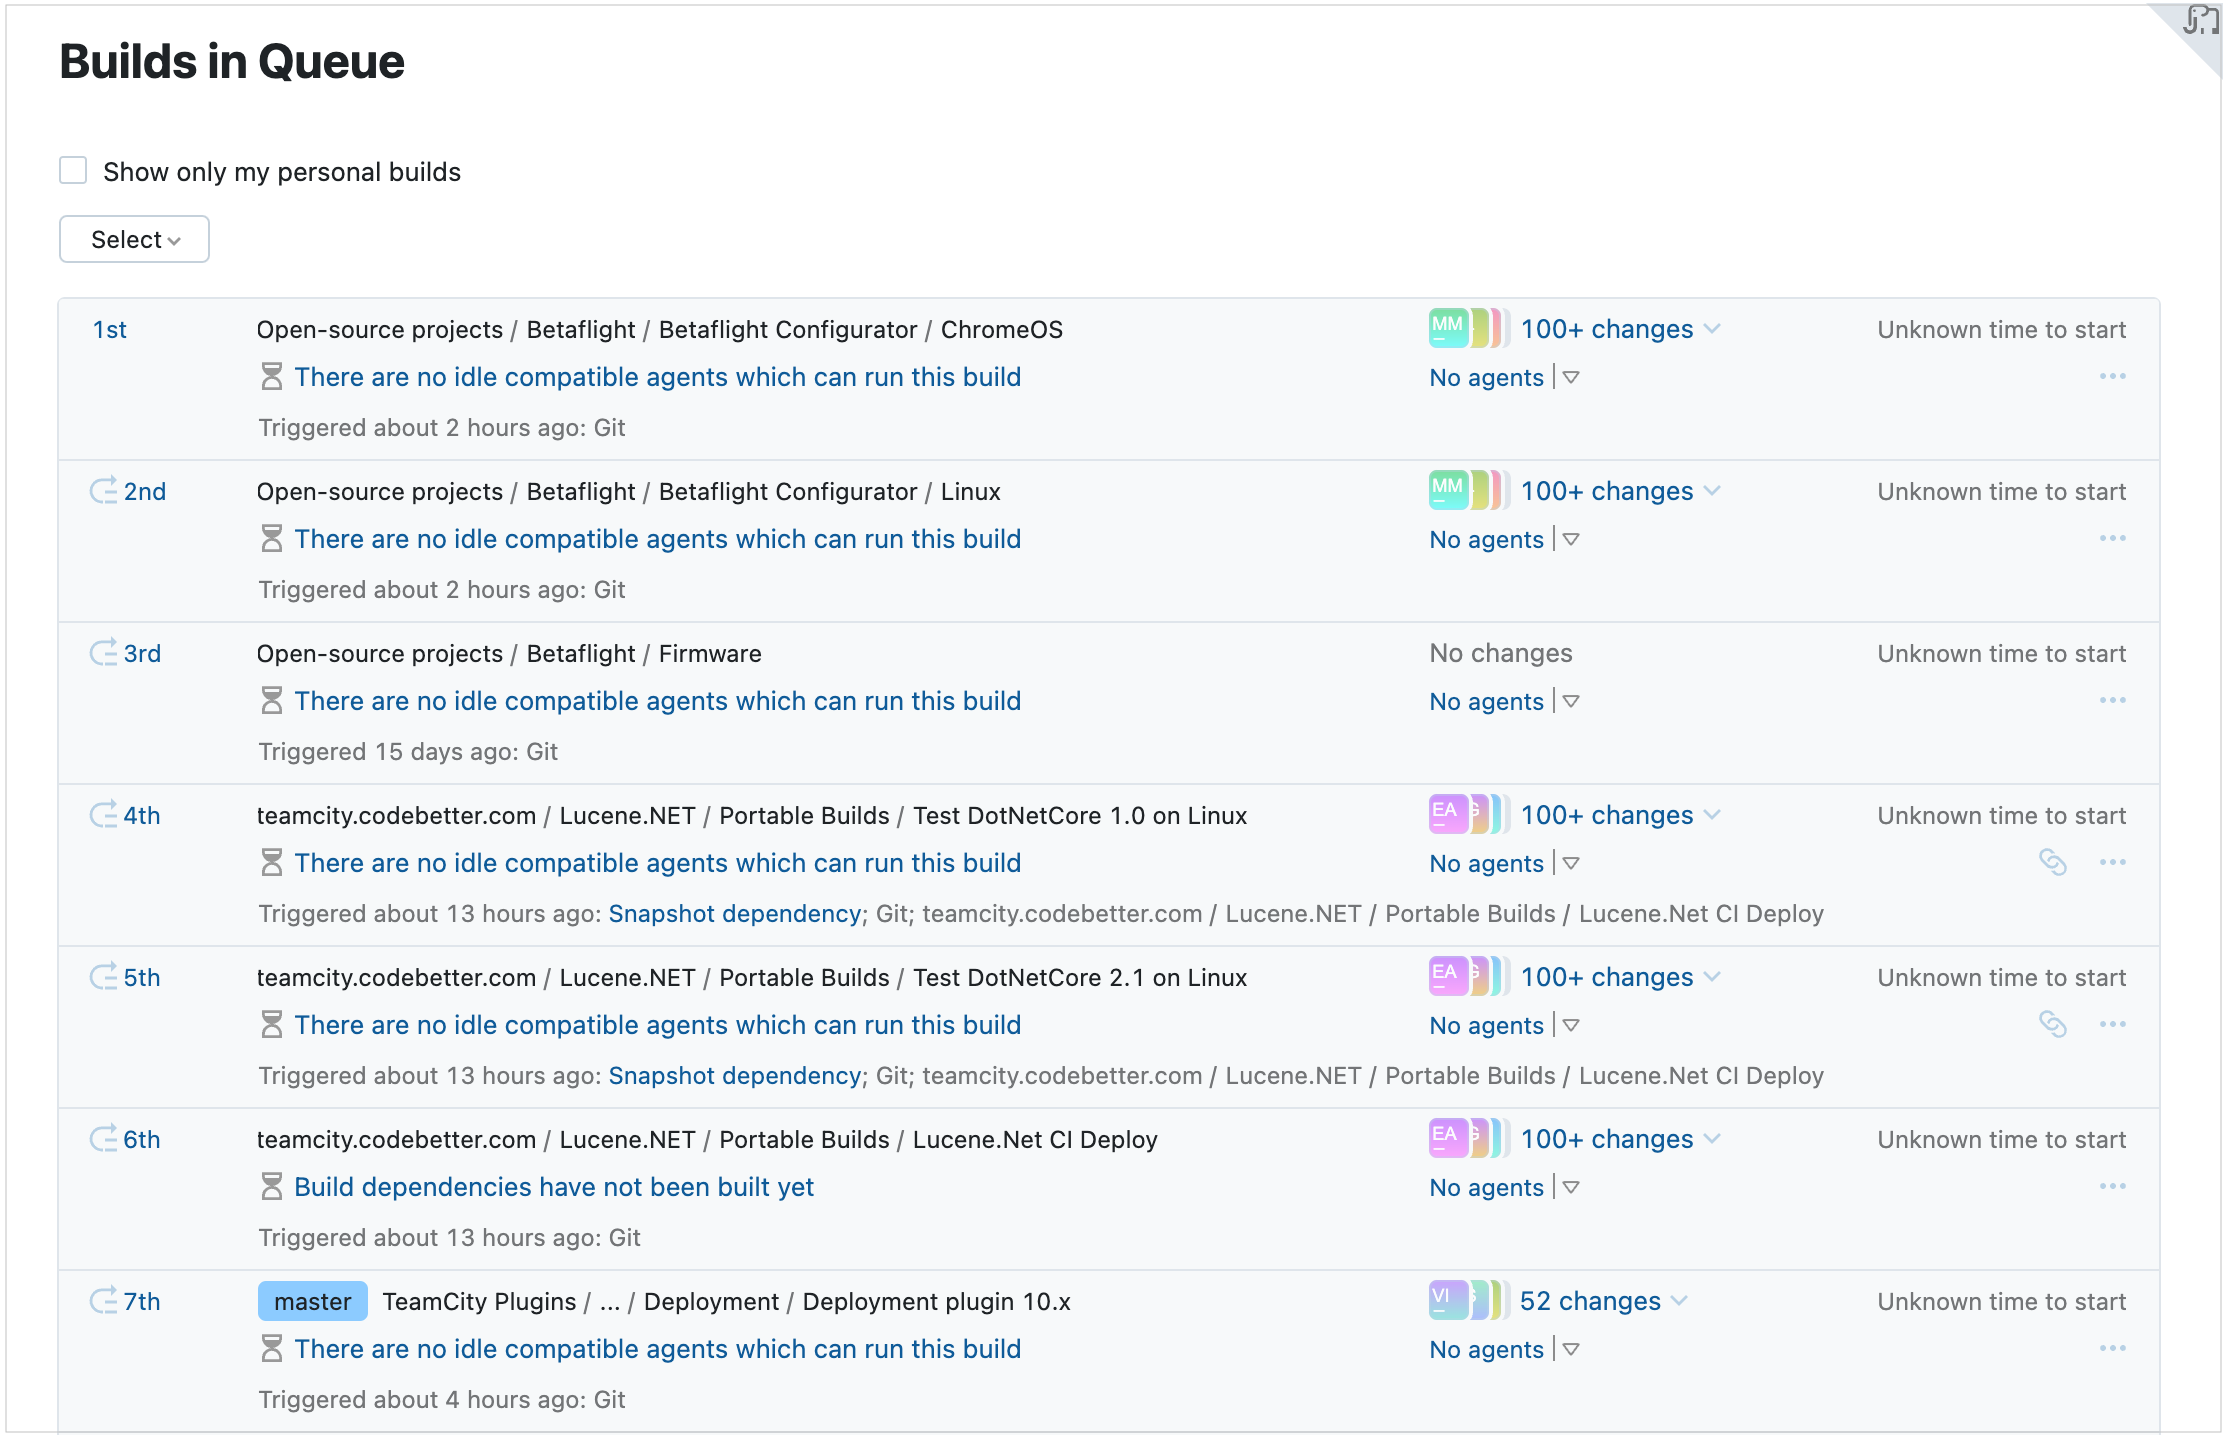
On this page, you can see the position of a build in the queue and view the queued build's details:
The Sakura UI extends the TeamCity plugin API and provides a set of handy tools to create plugins.
