Debug Jobs
Last modified: 08 December 2024Debugging a Job lets you run it directly from Edit mode, enabling quick testing of its settings without executing the entire Pipeline.
Start, Cancel, and Restart Debug Runs
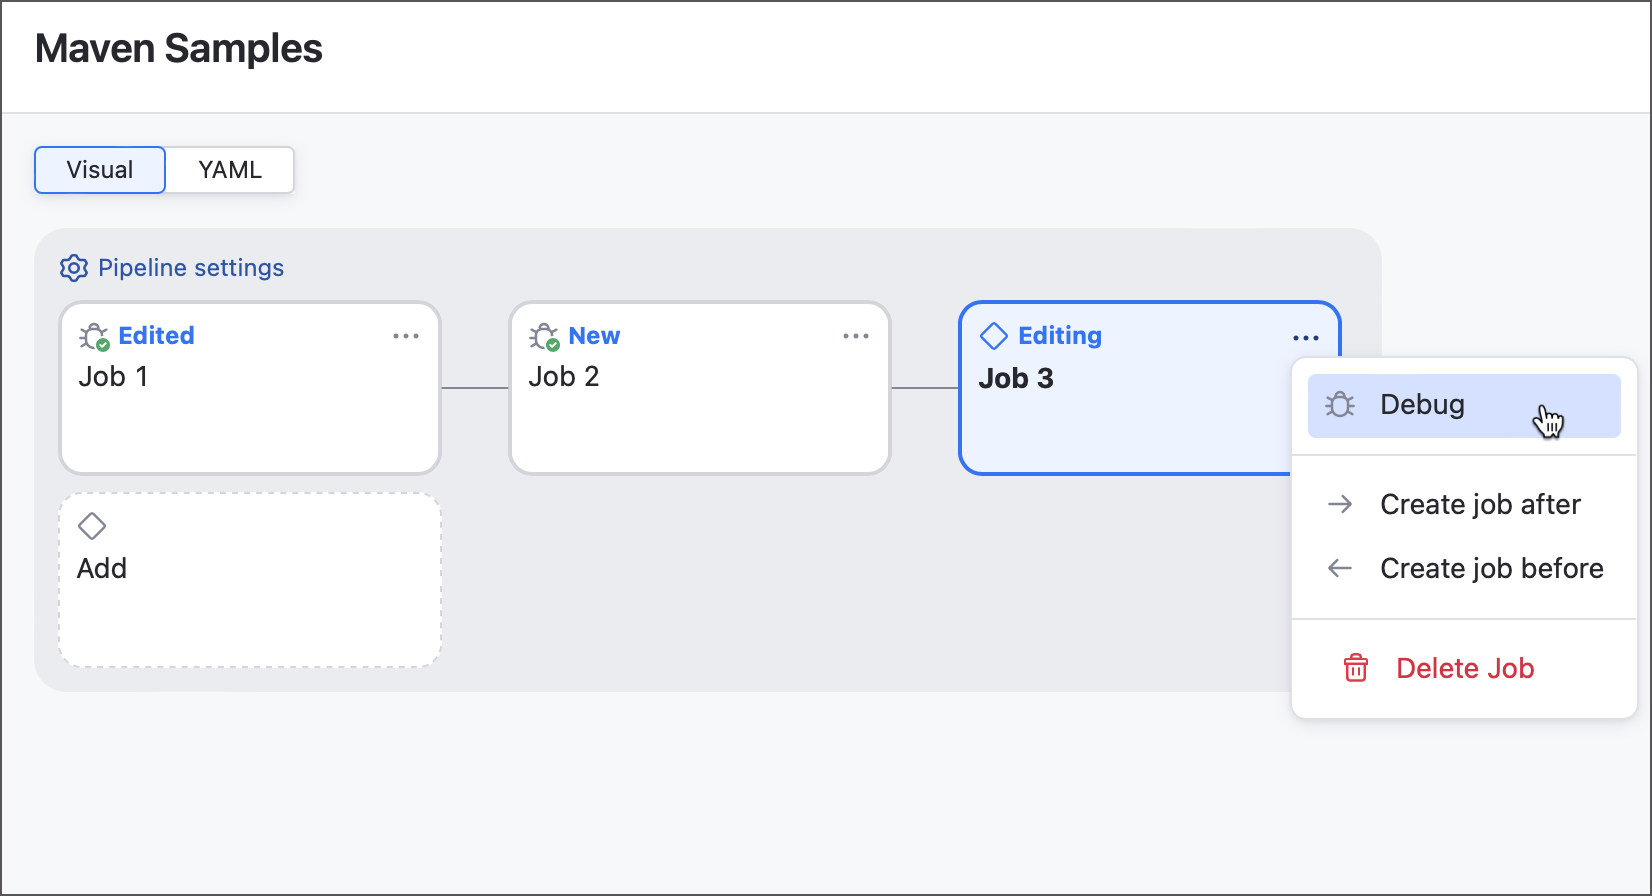
To debug a Job, click the ellipsis button in the top-right corner to open the quick actions menu and select the corresponding option.

This queues new runs for the selected Job and its dependencies. Job settings are locked during these test runs. To make changes, stop the debug run via the quick actions menu, edit the Job, and start a new debug session.
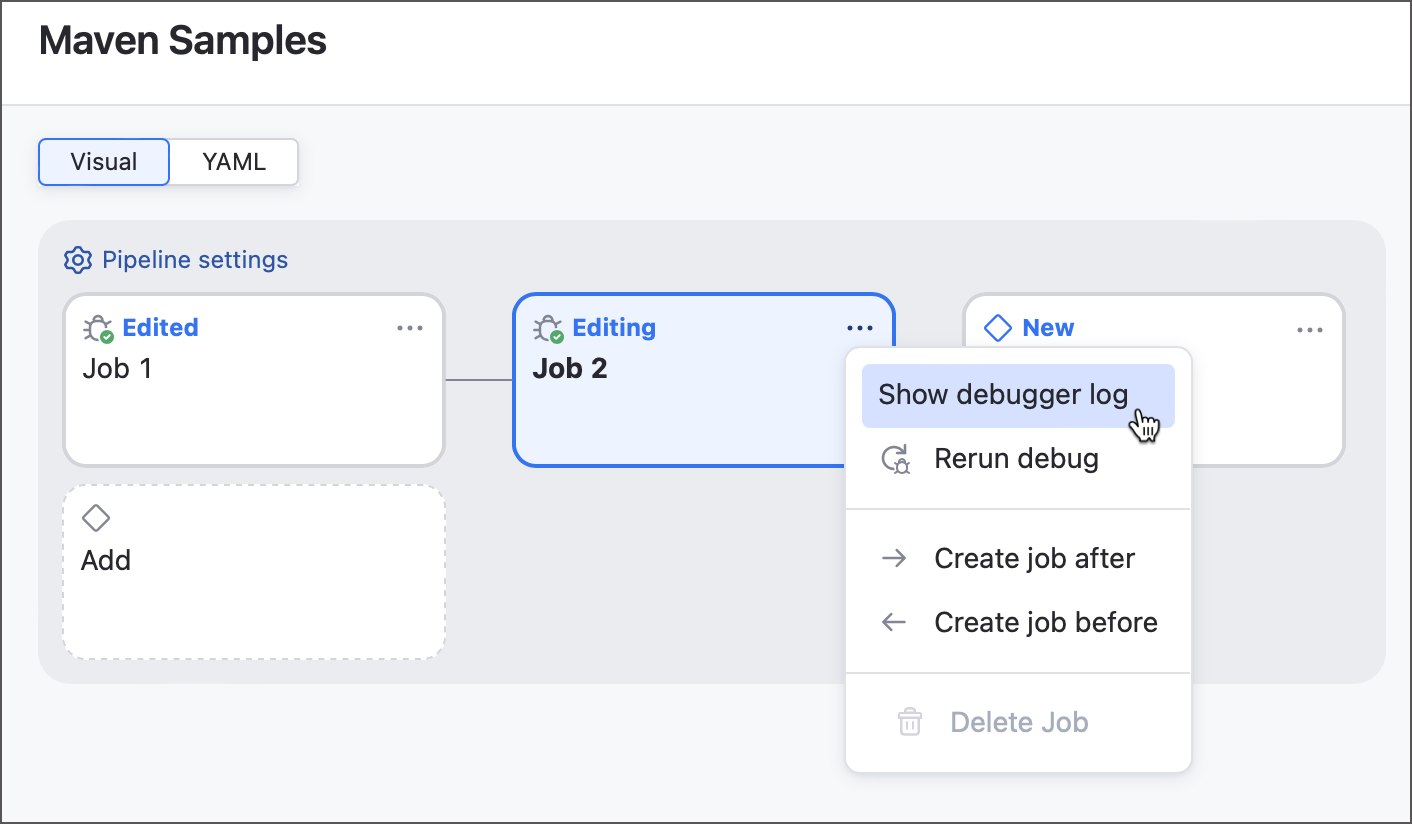
To rerun a debug with the same settings, choose Rerun debug. However, modifying the settings will disable both the Rerun debug and Show debugger log options.
Debug Log
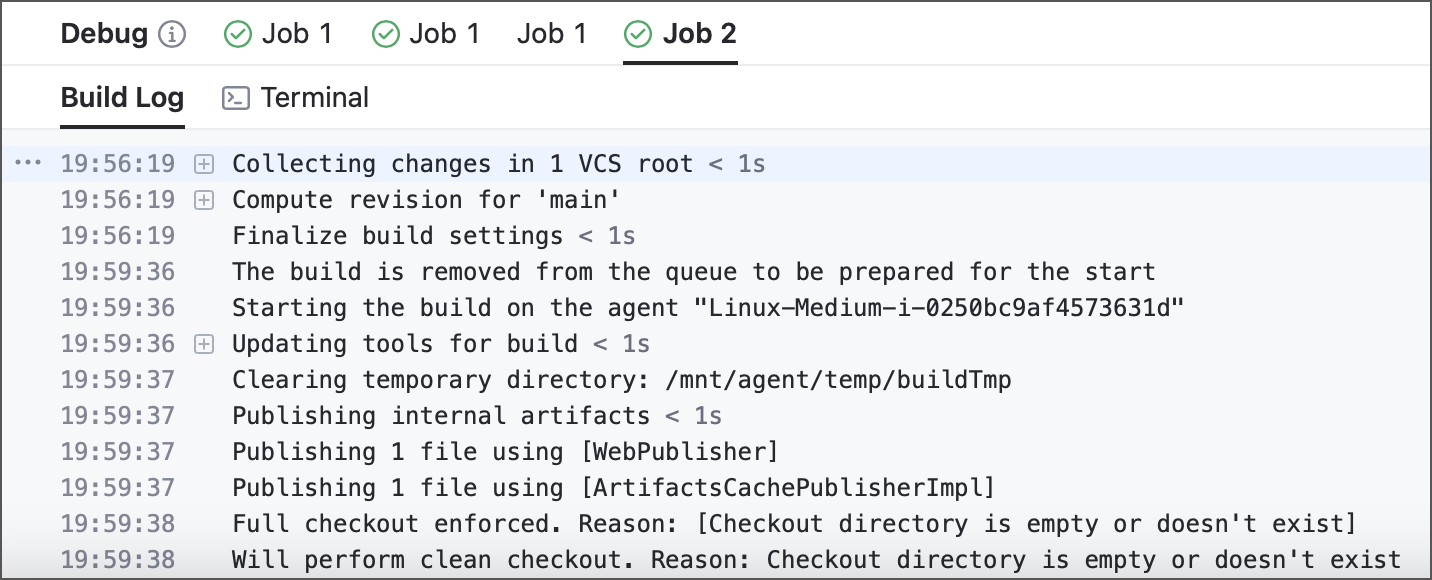
Queuing a Job debug run displays a build log with each affected Job categorized into a separate tab. Each debug run generates a new tab, preserving previous results for easy comparison.

If the panel is closed, you can access debug logs anytime by selecting Show debugger log in the quick actions menu.

This option is available for Jobs with at least one completed test run, provided their settings remain unchanged. Such Jobs display a debug icon in the top-left corner, indicating build logs are accessible.