Breakpoints
Breakpoints are source code markers that let you suspend program execution at a specific point and examine its behavior.
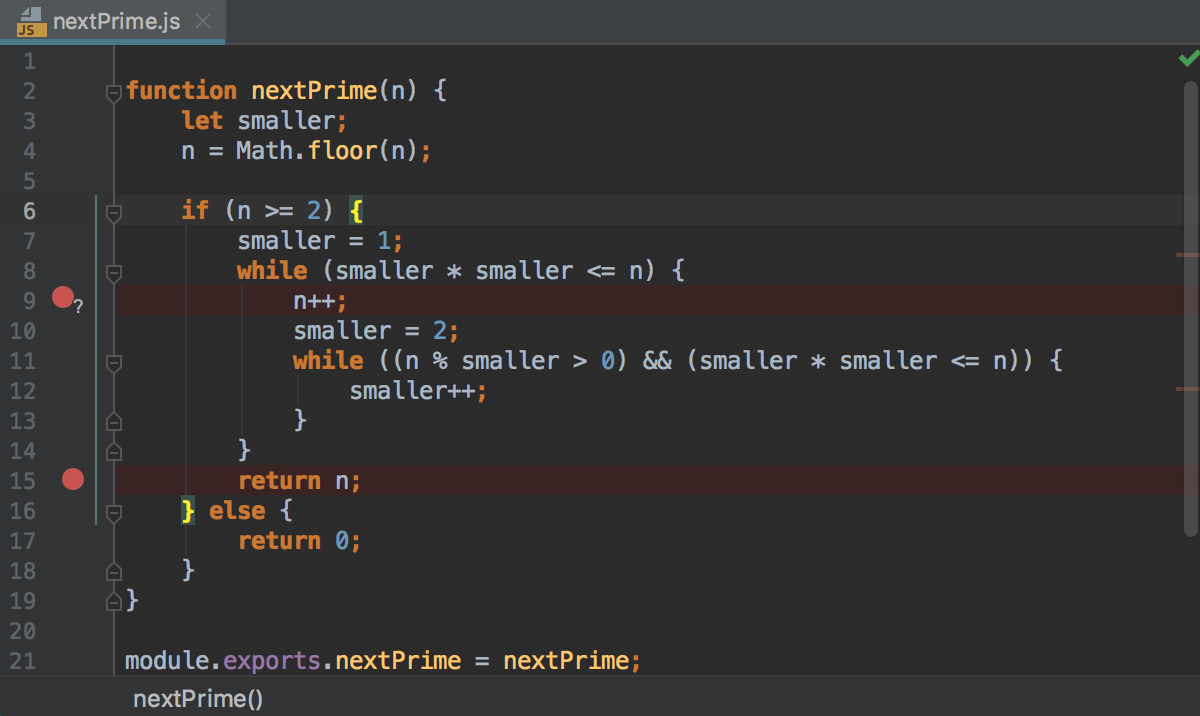
Once set, a breakpoint remains in your project until you remove it explicitly (except for temporary line breakpoints).
If a file with breakpoints was modified externally, for example, updated through a VCS or changed in an external editor, and the line numbers have changed, breakpoints will be moved accordingly. Note that WebStorm must be running when such changes are made, otherwise they will pass unnoticed.
Line breakpoints
Line breakpoints can be set on executable lines of code. Thread execution is suspended before the line with such breakpoint, and WebStorm displays the stack frames on that thread's stack.
Set a line breakpoint
Click the gutter next to the executable line of code where you want to set a breakpoint.
Alternatively, place the caret at this line and press Ctrl+F8.
To set a temporary line breakpoint, press Ctrl+Alt+Shift+F8. The breakpoint will be removed from your project right after it is hit.
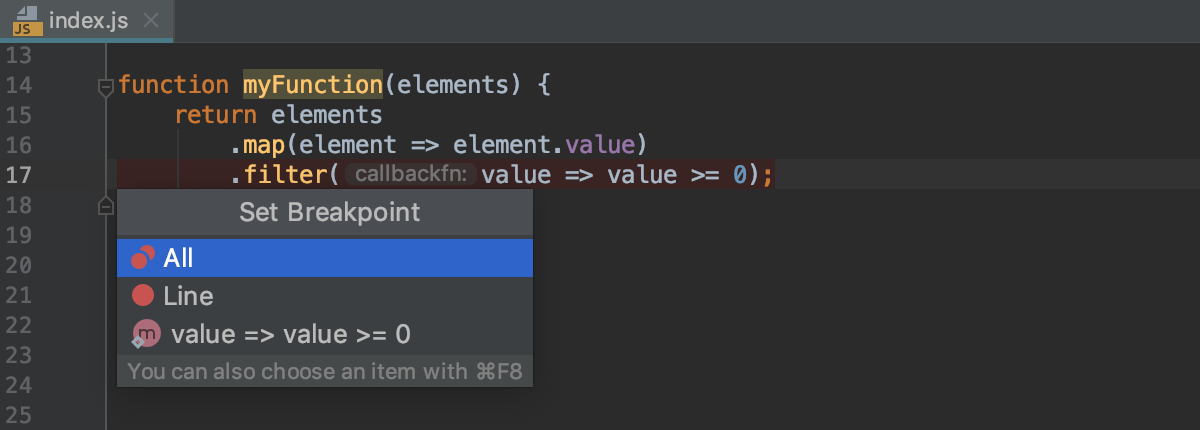
For arrow functions, you can set multiple breakpoints within a single line. Click the gutter and select the functions where you want to set breakpoints.
Remove a line breakpoint
Click the breakpoint icon in the gutter.
To avoid accidentally removing a breakpoint and losing its parameters, you can choose to remove breakpoints by dragging them to the editor, or by clicking the middle mouse button: open the Settings/Preferences dialog Ctrl+Alt+S, go to Build, Execution, Deployment | Debugger, and select Drag to the editor or click with middle mouse button. Clicking a breakpoint will then toggle its state (enabled/disabled).
Exception breakpoints
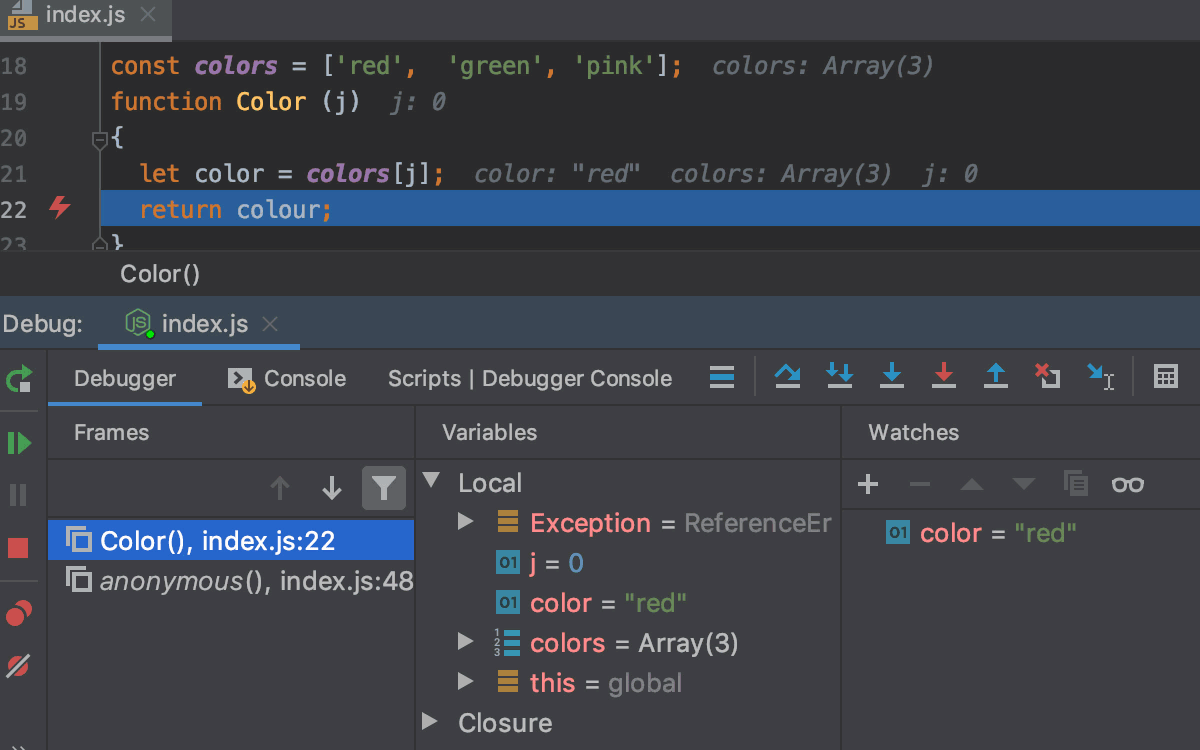
Exception breakpoints are triggered when the specified exception is thrown.
Set an exception breakpoint
Press Ctrl+Shift+F8 or select Run | View Breakpoints from the main menu.
In the Breakpoints dialog, select the Any exception checkbox.
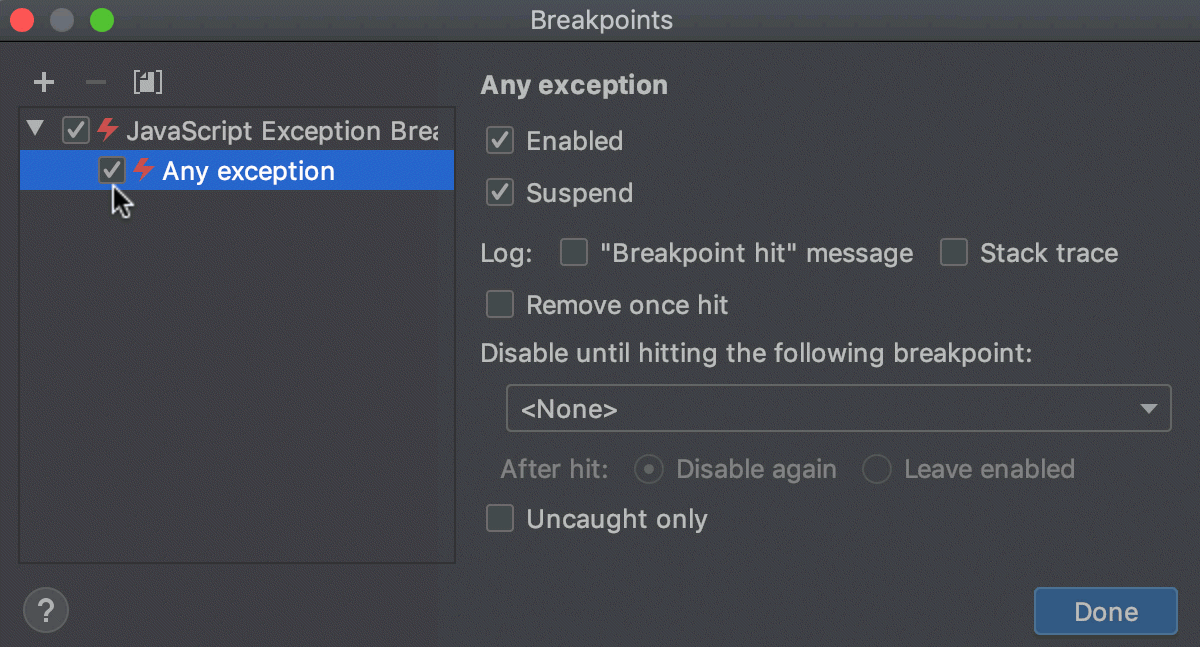
To have the debugger stop at exceptions of a specific type, press Alt+Insert or click
and select JavaScript Exception Breakpoint. Then, in the Add Exception Breakpoint dialog that opens, specify an exception class from a library or from your project.
 Gif
Gif
Remove an exception breakpoint
Press Ctrl+Shift+F8 or select Run | View Breakpoints from the main menu.
In the Breakpoints dialog, select the breakpoint you want to delete under JavaScript Exception Breakpoints or Dart Exception Breakpoints and click
or press Alt+Delete.
Breakpoints properties
Depending on the type of a breakpoint, you can configure the following additional breakpoint properties:
Actions to be performed when the breakpoint is hit
A suspend policy that defines whether the application must be suspended when the breakpoint is hit
Dependencies on other breakpoints
Conditions that define when the breakpoint must be hit
To edit the properties of a breakpoint, press Ctrl+Shift+F8, or right-click the breakpoint in the editor gutter.
| Option | Description | Breakpoint type |
|---|---|---|
| Enabled | Clear the checkbox to temporarily disable the breakpoint without removing it from the project. Disabled breakpoints will be skipped during the debugging process. | All types |
| Suspend | Select the checkbox to pause the program execution when the breakpoint is hit. Suspending an application is useful if you need to obtain logging information or calculate an expression at a certain point without interrupting the program. If you need to create a master breakpoint that will trigger dependent breakpoints when hit, choose not to suspend the program at that breakpoint. | All types |
| Condition | Select this checkbox if you want the debugger to stop at the breakpoint only when a certain condition is met. Define the condition through a JavaScript boolean expression that evaluates to You can type multiline expressions, for example: Optionally, specify the actions that you want WebStorm to perform if the condition is met and the debugger stops at the breakpoint, learn more from Log below. 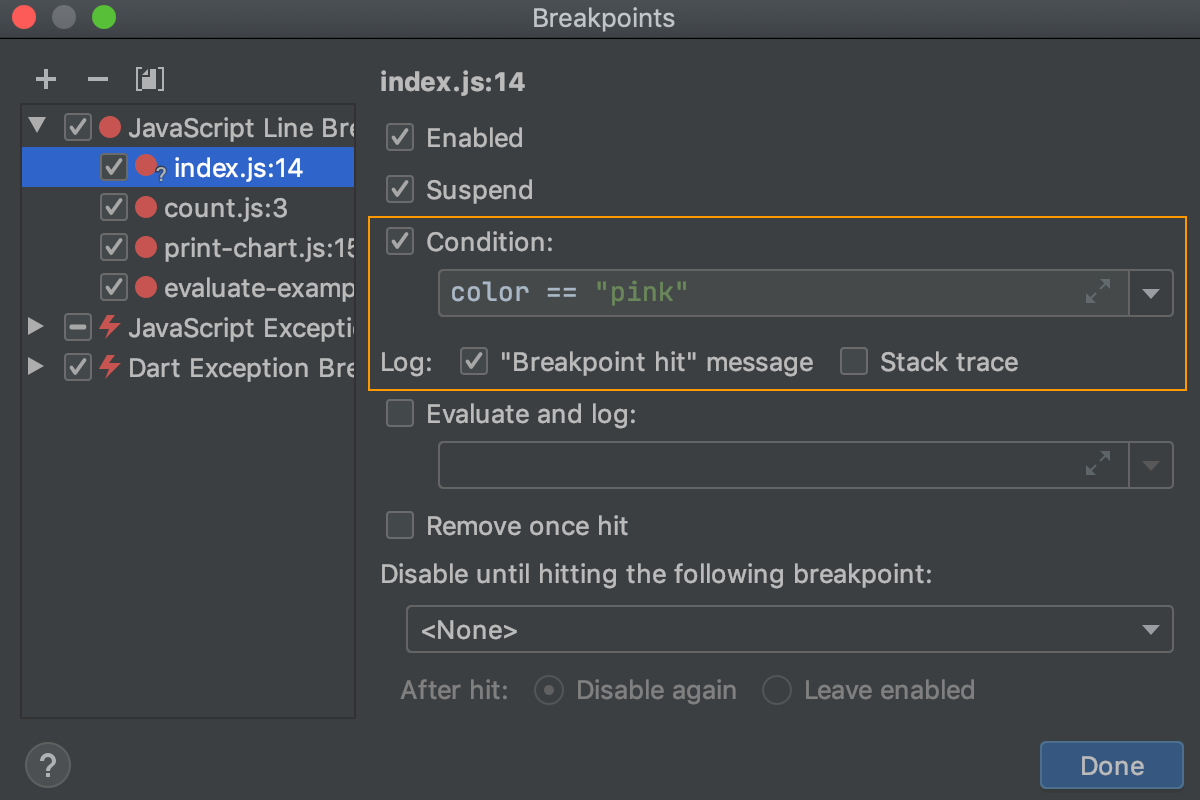 When the debugger reaches the line with a conditional breakpoint, the specified boolean expression is evaluated. If the expression evaluates to 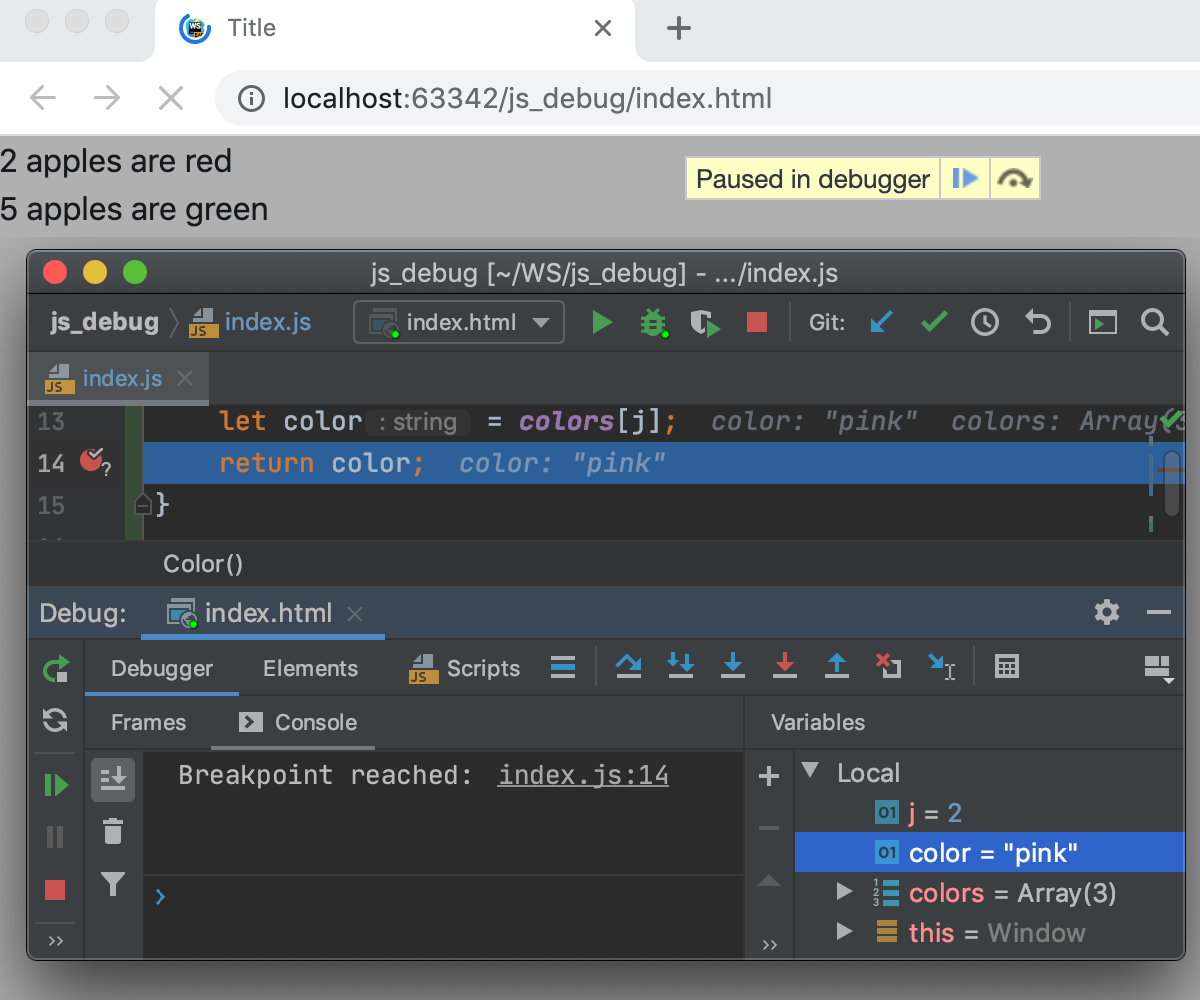 | Line breakpoints |
| Log | Select if you want to log the following events to the console:
| All types |
| Evaluate and log | Select to evaluate an expression when the breakpoint is hit, and show the result in the console output. | Line breakpoints |
| Remove once hit | Select to remove the breakpoint from your project right after it has been hit. | All types |
| Disable until breakpoint is hit | Select the breakpoint that will trigger the current breakpoint. Until that breakpoint is hit, the current breakpoint will be disabled. You can also select if you wish to disable it again or leave it enabled once it has been hit. | All types |
Productivity tips
- Quick access to most common settings
Right-click a breakpoint in the editor gutter to quickly disable or suspend it, or set a condition.
- Breakpoints intentions
You can get access to the most common breakpoint actions and filters through intention actions (Alt+Enter).

- Group breakpoints
You can organize breakpoints into groups, for example, if you need to mark out breakpoints for a specific problem.
In the Breakpoints dialog Ctrl+Shift+F8, select a breakpoint you want to place in a group and choose Move to group | <group_name>/Create new from the context menu.
- Move breakpoints
To move a line breakpoint, drag it to the target line.
- Copy breakpoints
To copy a breakpoint, press Ctrl and drag it to the target line.
- Disable breakpoints
To temporarily disable a breakpoint without removing it from the project, hold down the Alt key and click the breakpoint icon in gutter.
- Quick search
If you have many breakpoints in your project, you can add short descriptions to them to search for them easily: right-click a breakpoint in the Breakpoints dialog Ctrl+Shift+F8 and select Edit description from the context menu. Now when you start typing a breakpoint's name, it gets the focus.
- Jump to source
To jump from the Breakpoints dialog to the line of code where the selected breakpoint is set, press F4.