Web UI Test Automation
The web UI test automation functionality in WebStorm is provided by the Test Automation plugin. This plugin helps develop and maintain automated UI tests, and comprises a significant part of the features provided by Aqua – a standalone JetBrains IDE for test automation.
The Test Automation plugin provides the following features:
Rich support of Cypress and Playwright frameworks
Extensive coding assistance
For more information about test automation features, refer to the official Aqua documentation.
Install the Test Automation plugin
In the Settings dialog (Ctrl+Alt+S) , select Plugins.
Switch to the Marketplace tab, type
Test Automation, and click Install.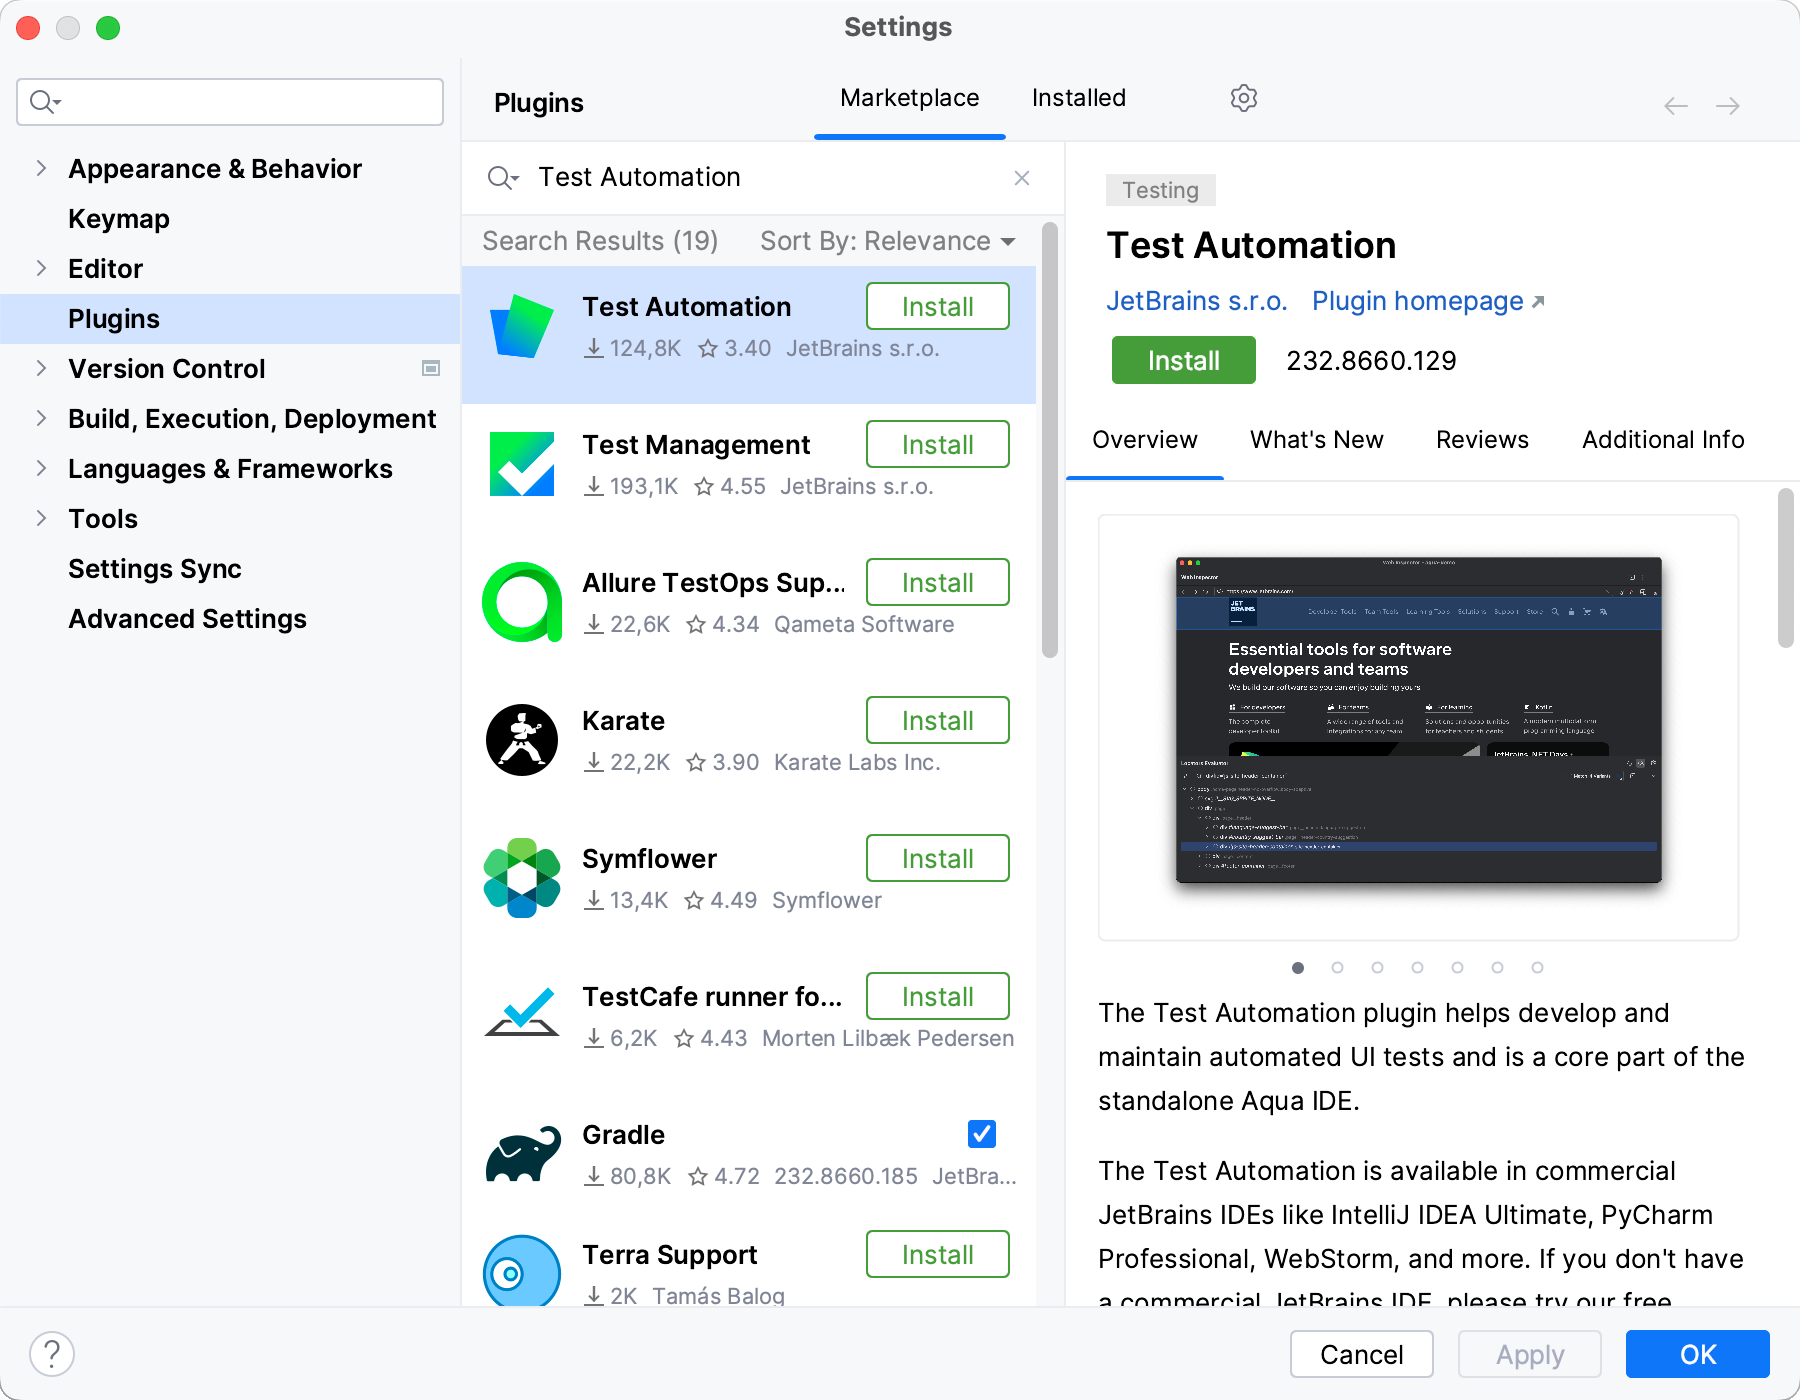
Click Apply to save the changes and close the dialog. Restart the IDE if prompted.
Test automation features
Tests recognition
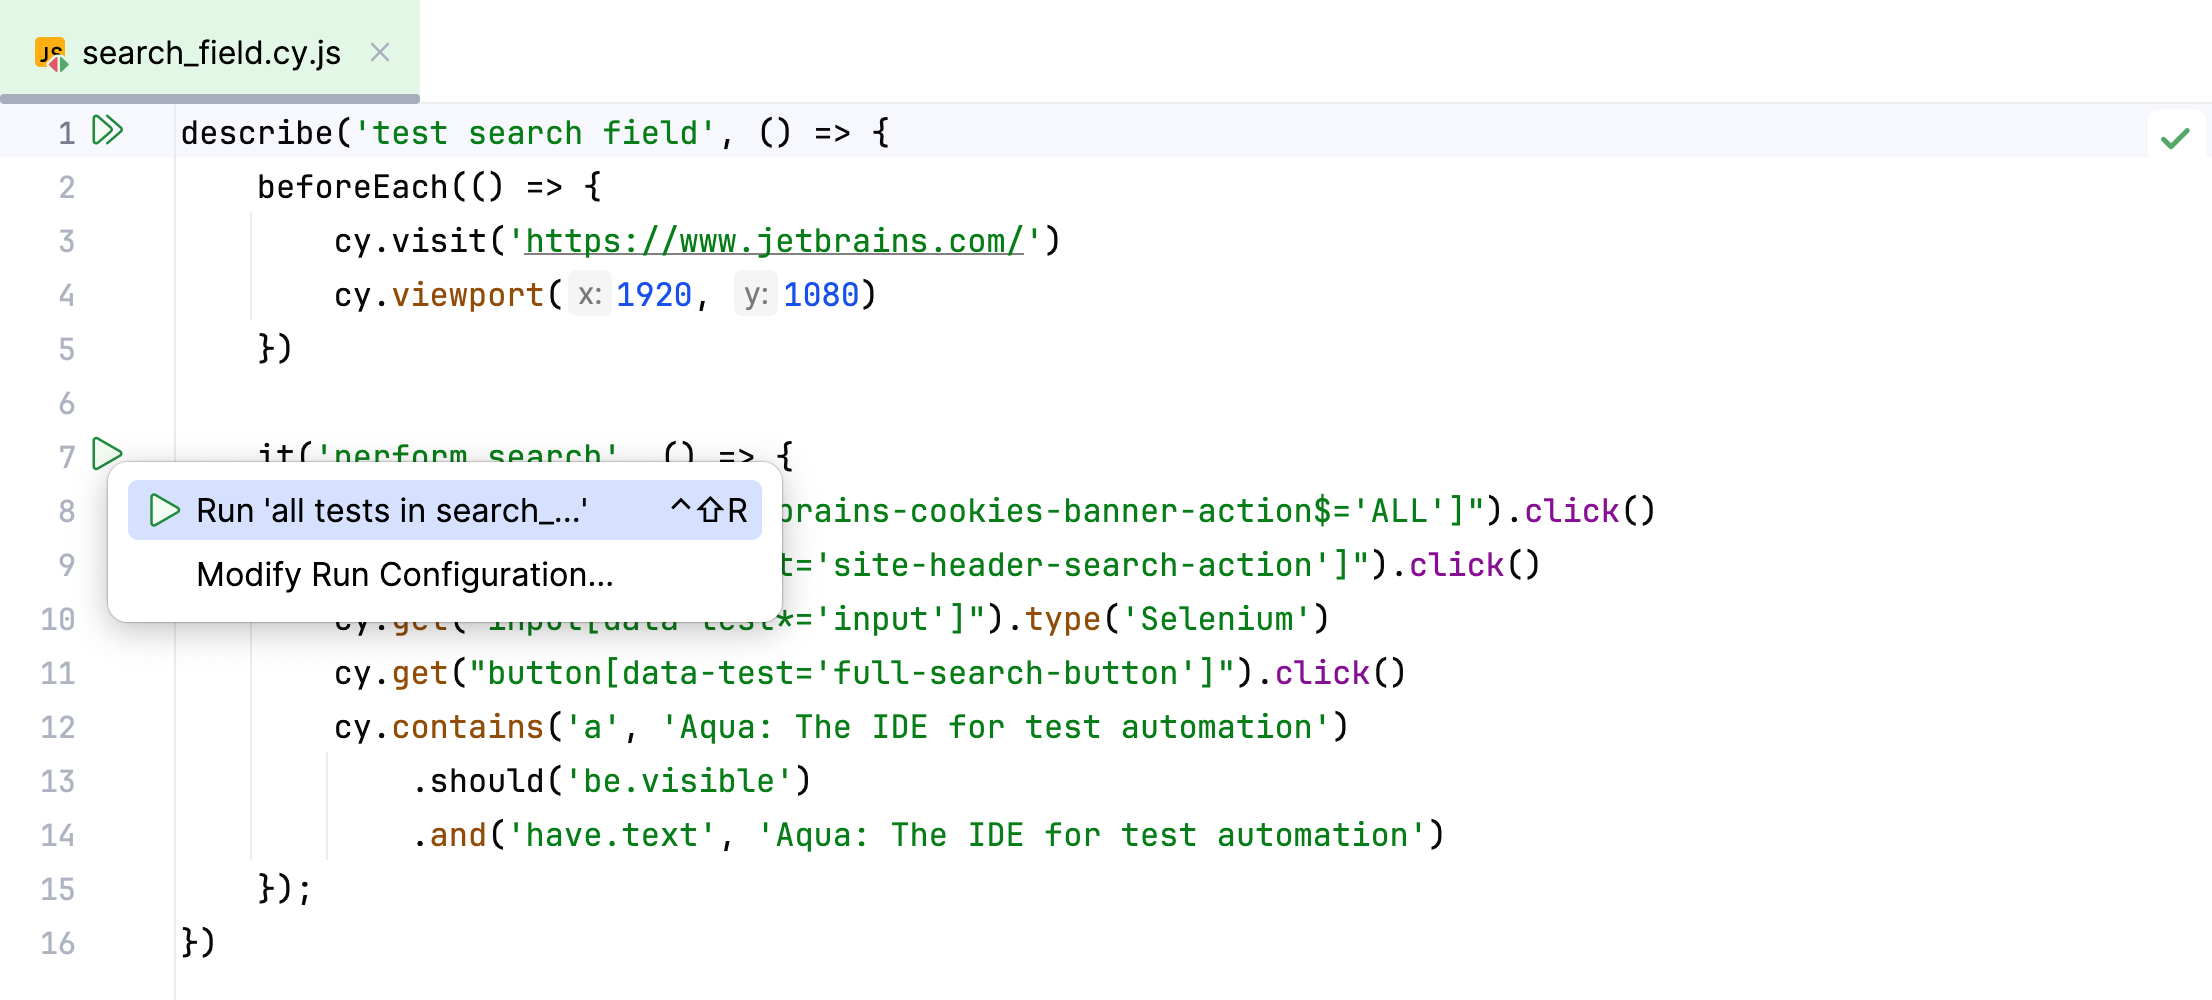
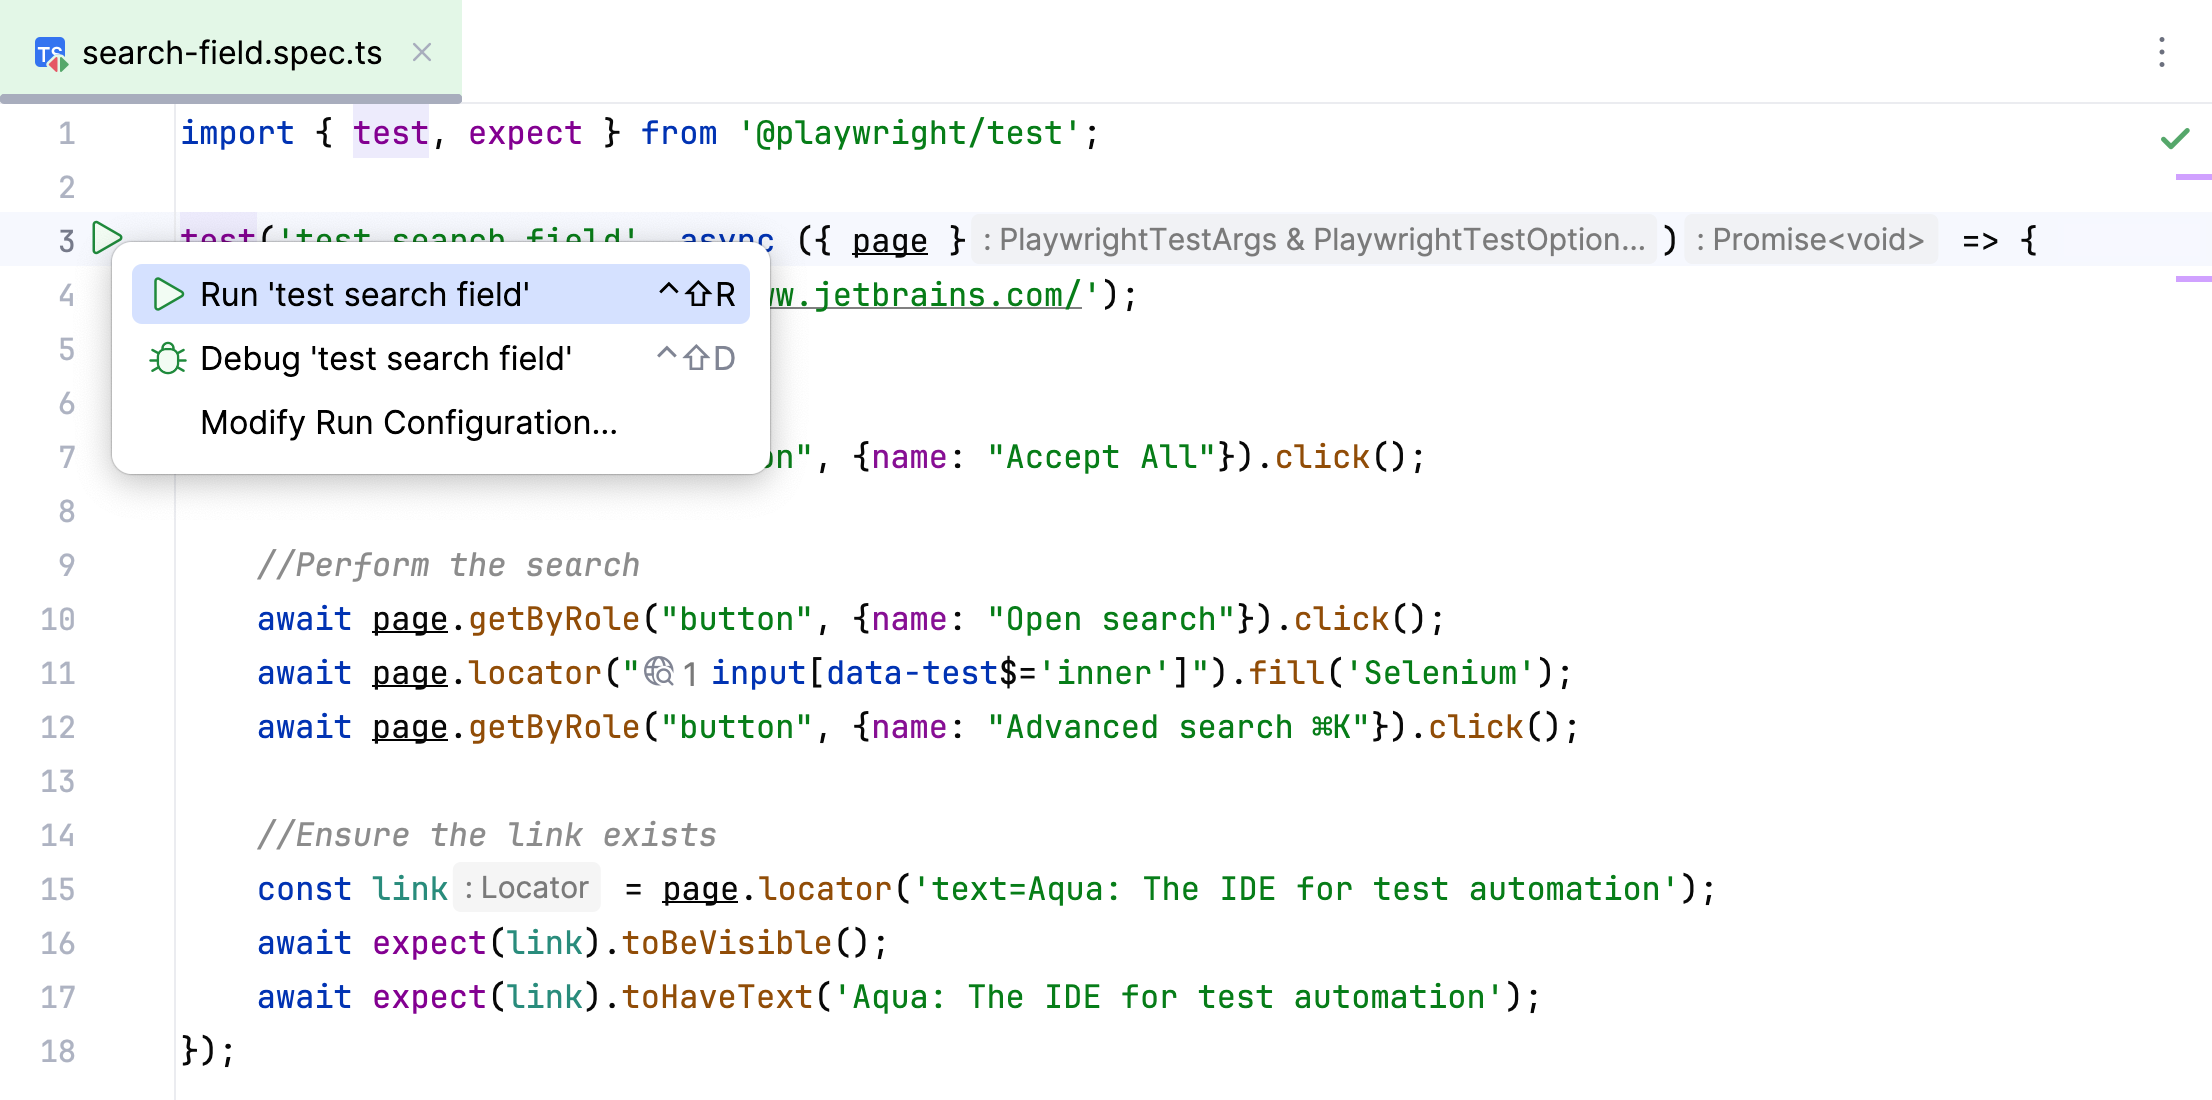
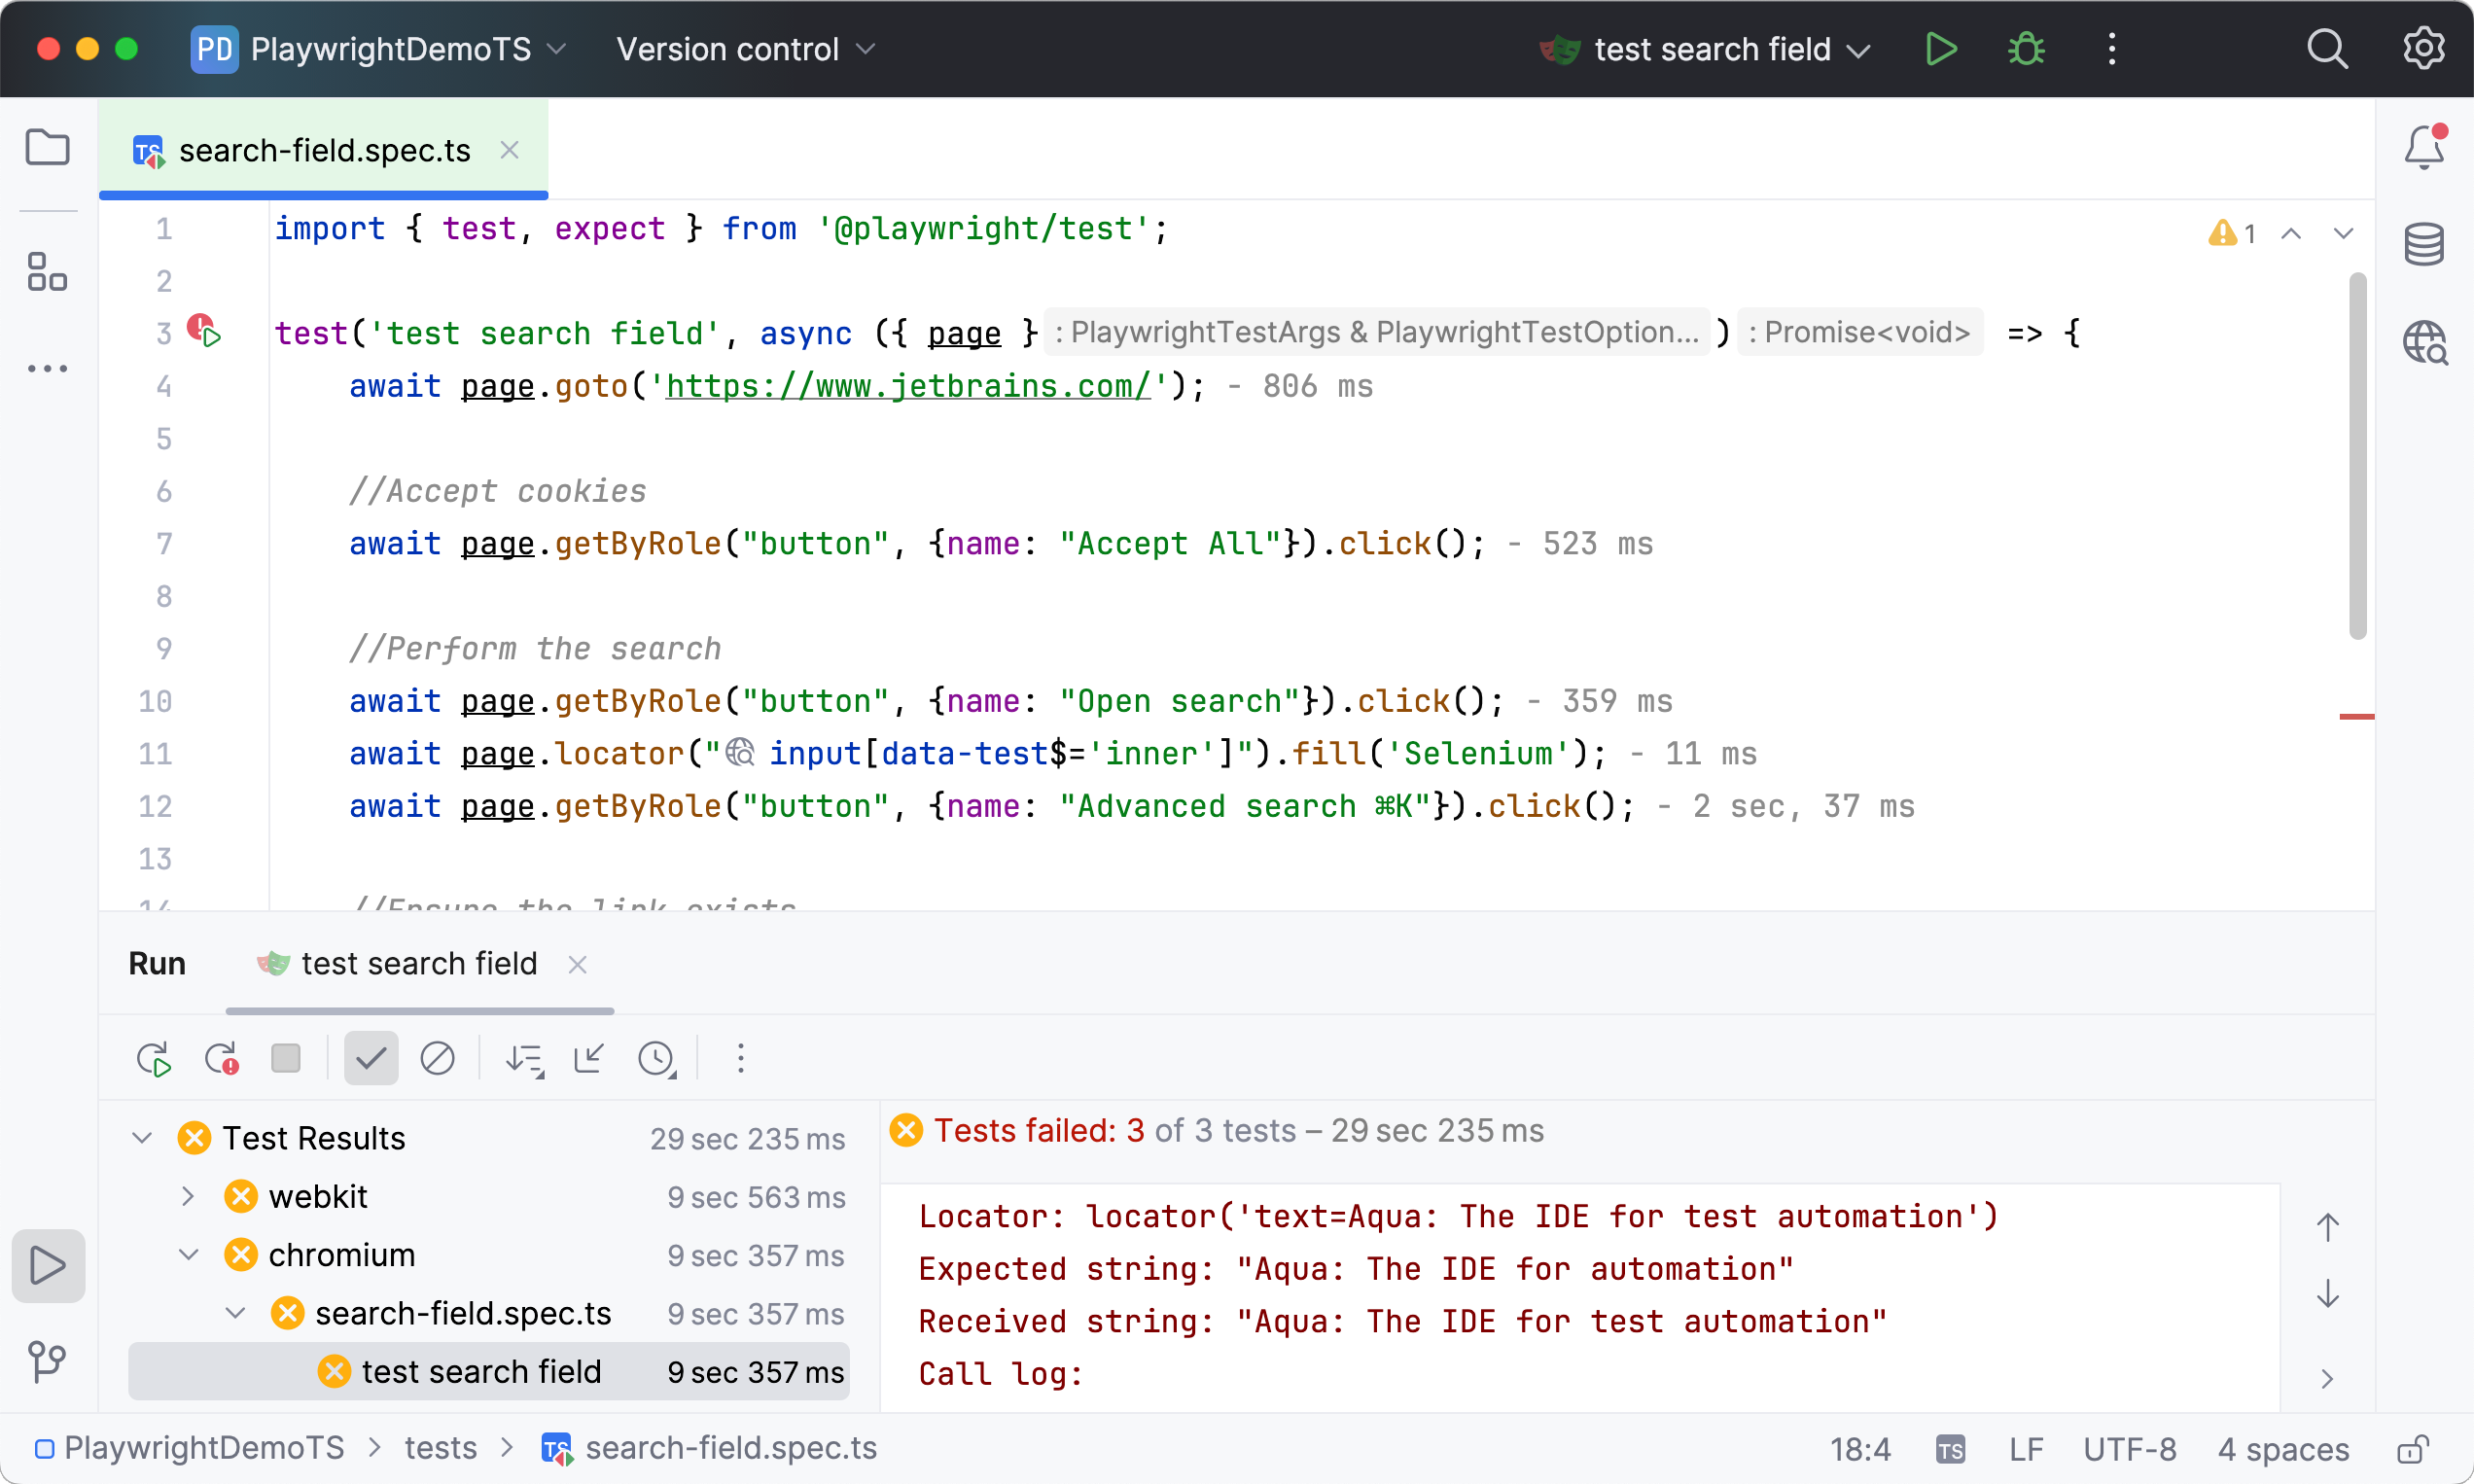
When you open your project, WebStorm automatically detects tests written in Cypress or Playwright. The recognized tests can be run by clicking the icon in the gutter, and then analyzed/debugged using IDE's tools.
Coding assistance
Provided coding assistance features include intelligent code completion, navigation, syntax highlighting, support for framework-specific functions and expressions, and more.
For example, you can start typing the locator or its substring in the code editor, and the auto-completion feature will provide you with a list of elements to select from. Additionally, the selected element will be highlighted in Web Inspector, making it easier to choose the correct locator.
Locators generation and validation
The Web Inspector tool window allows you to view web applications and capture page elements required for automated tests. When you select the required element on the web page, WebStorm generates a unique CSS or XPath locator and helps add it to the source code.
Additionally, WebStorm can generate role-based locators used in Playwright. These locators are designed to reflect the element’s role (for example, a button or a checkbox), making its identification easier.
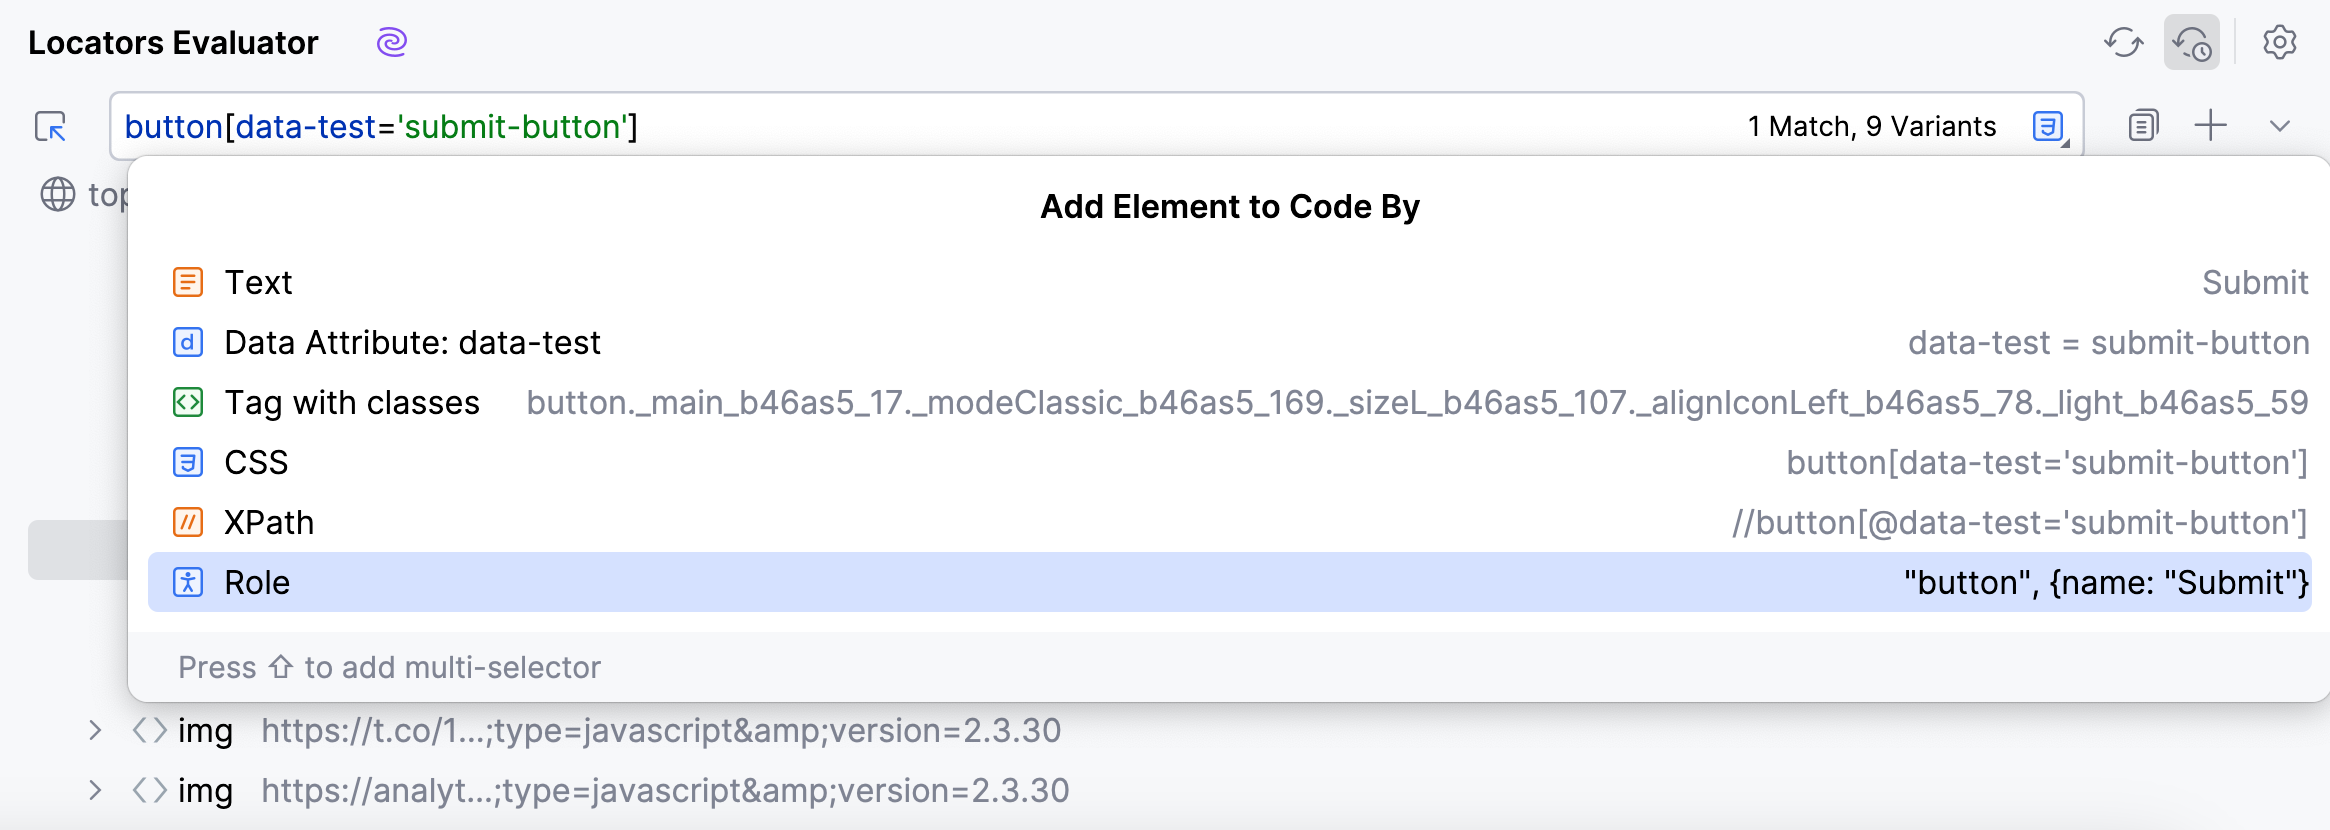
Moreover, Web Inspector helps you verify that the locators in your code are valid and point to the correct elements on the web page. Clicking the icon next to the locator in the code editor opens the Web Inspector and selects the corresponding element, thus validating the locator.
Manage run/debug configurations for tests
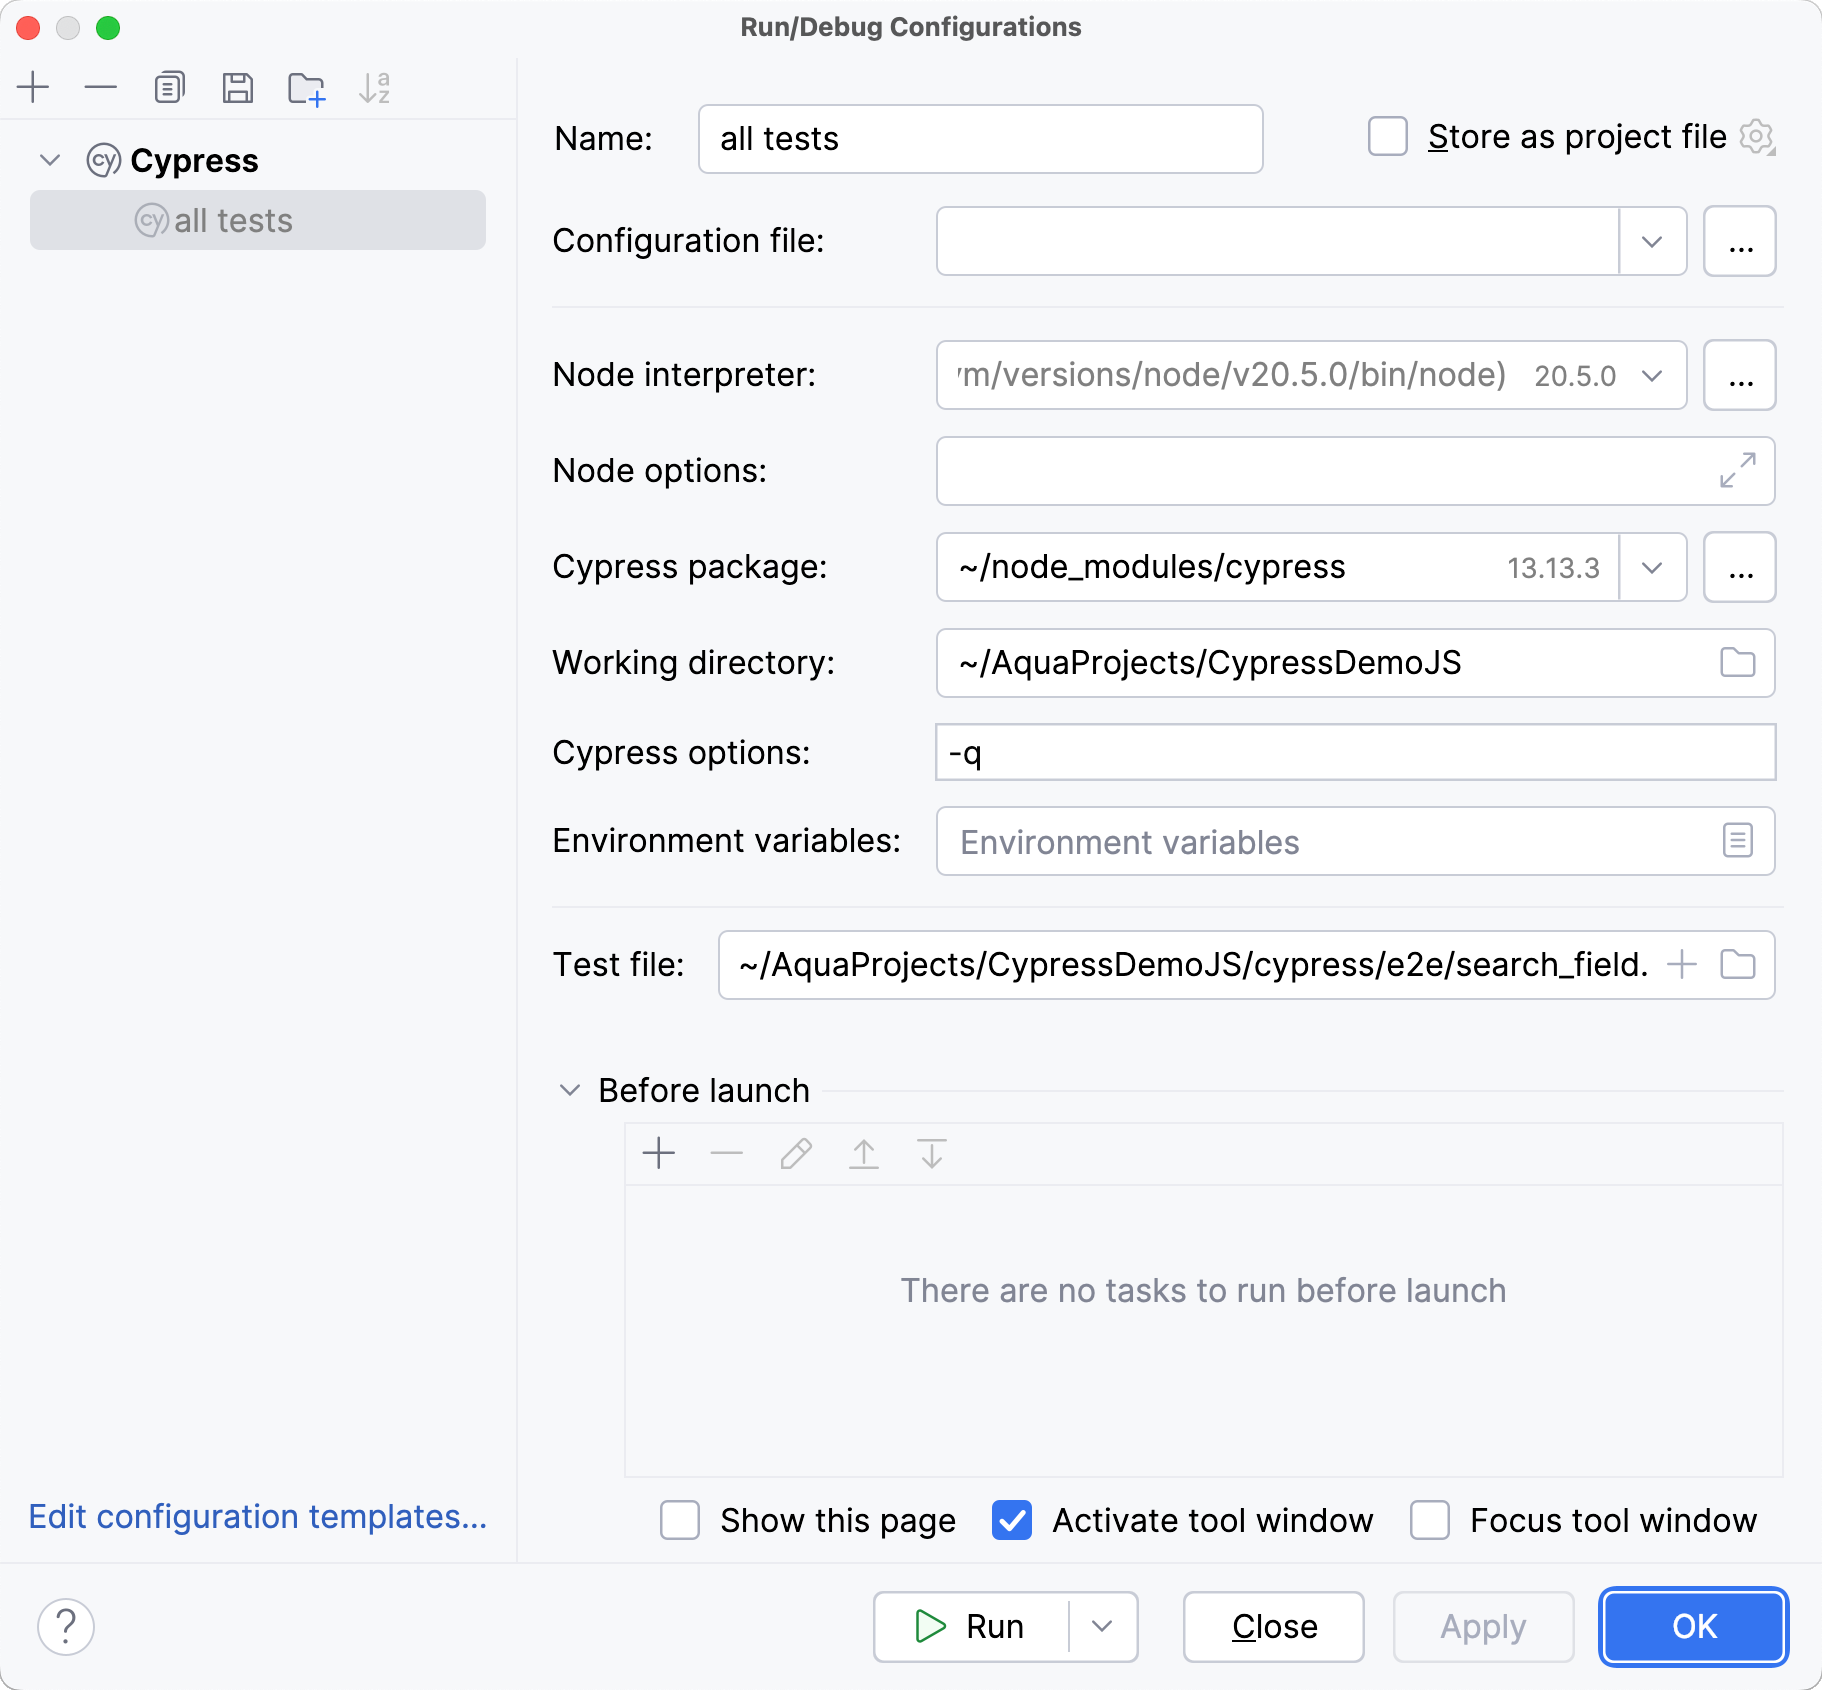
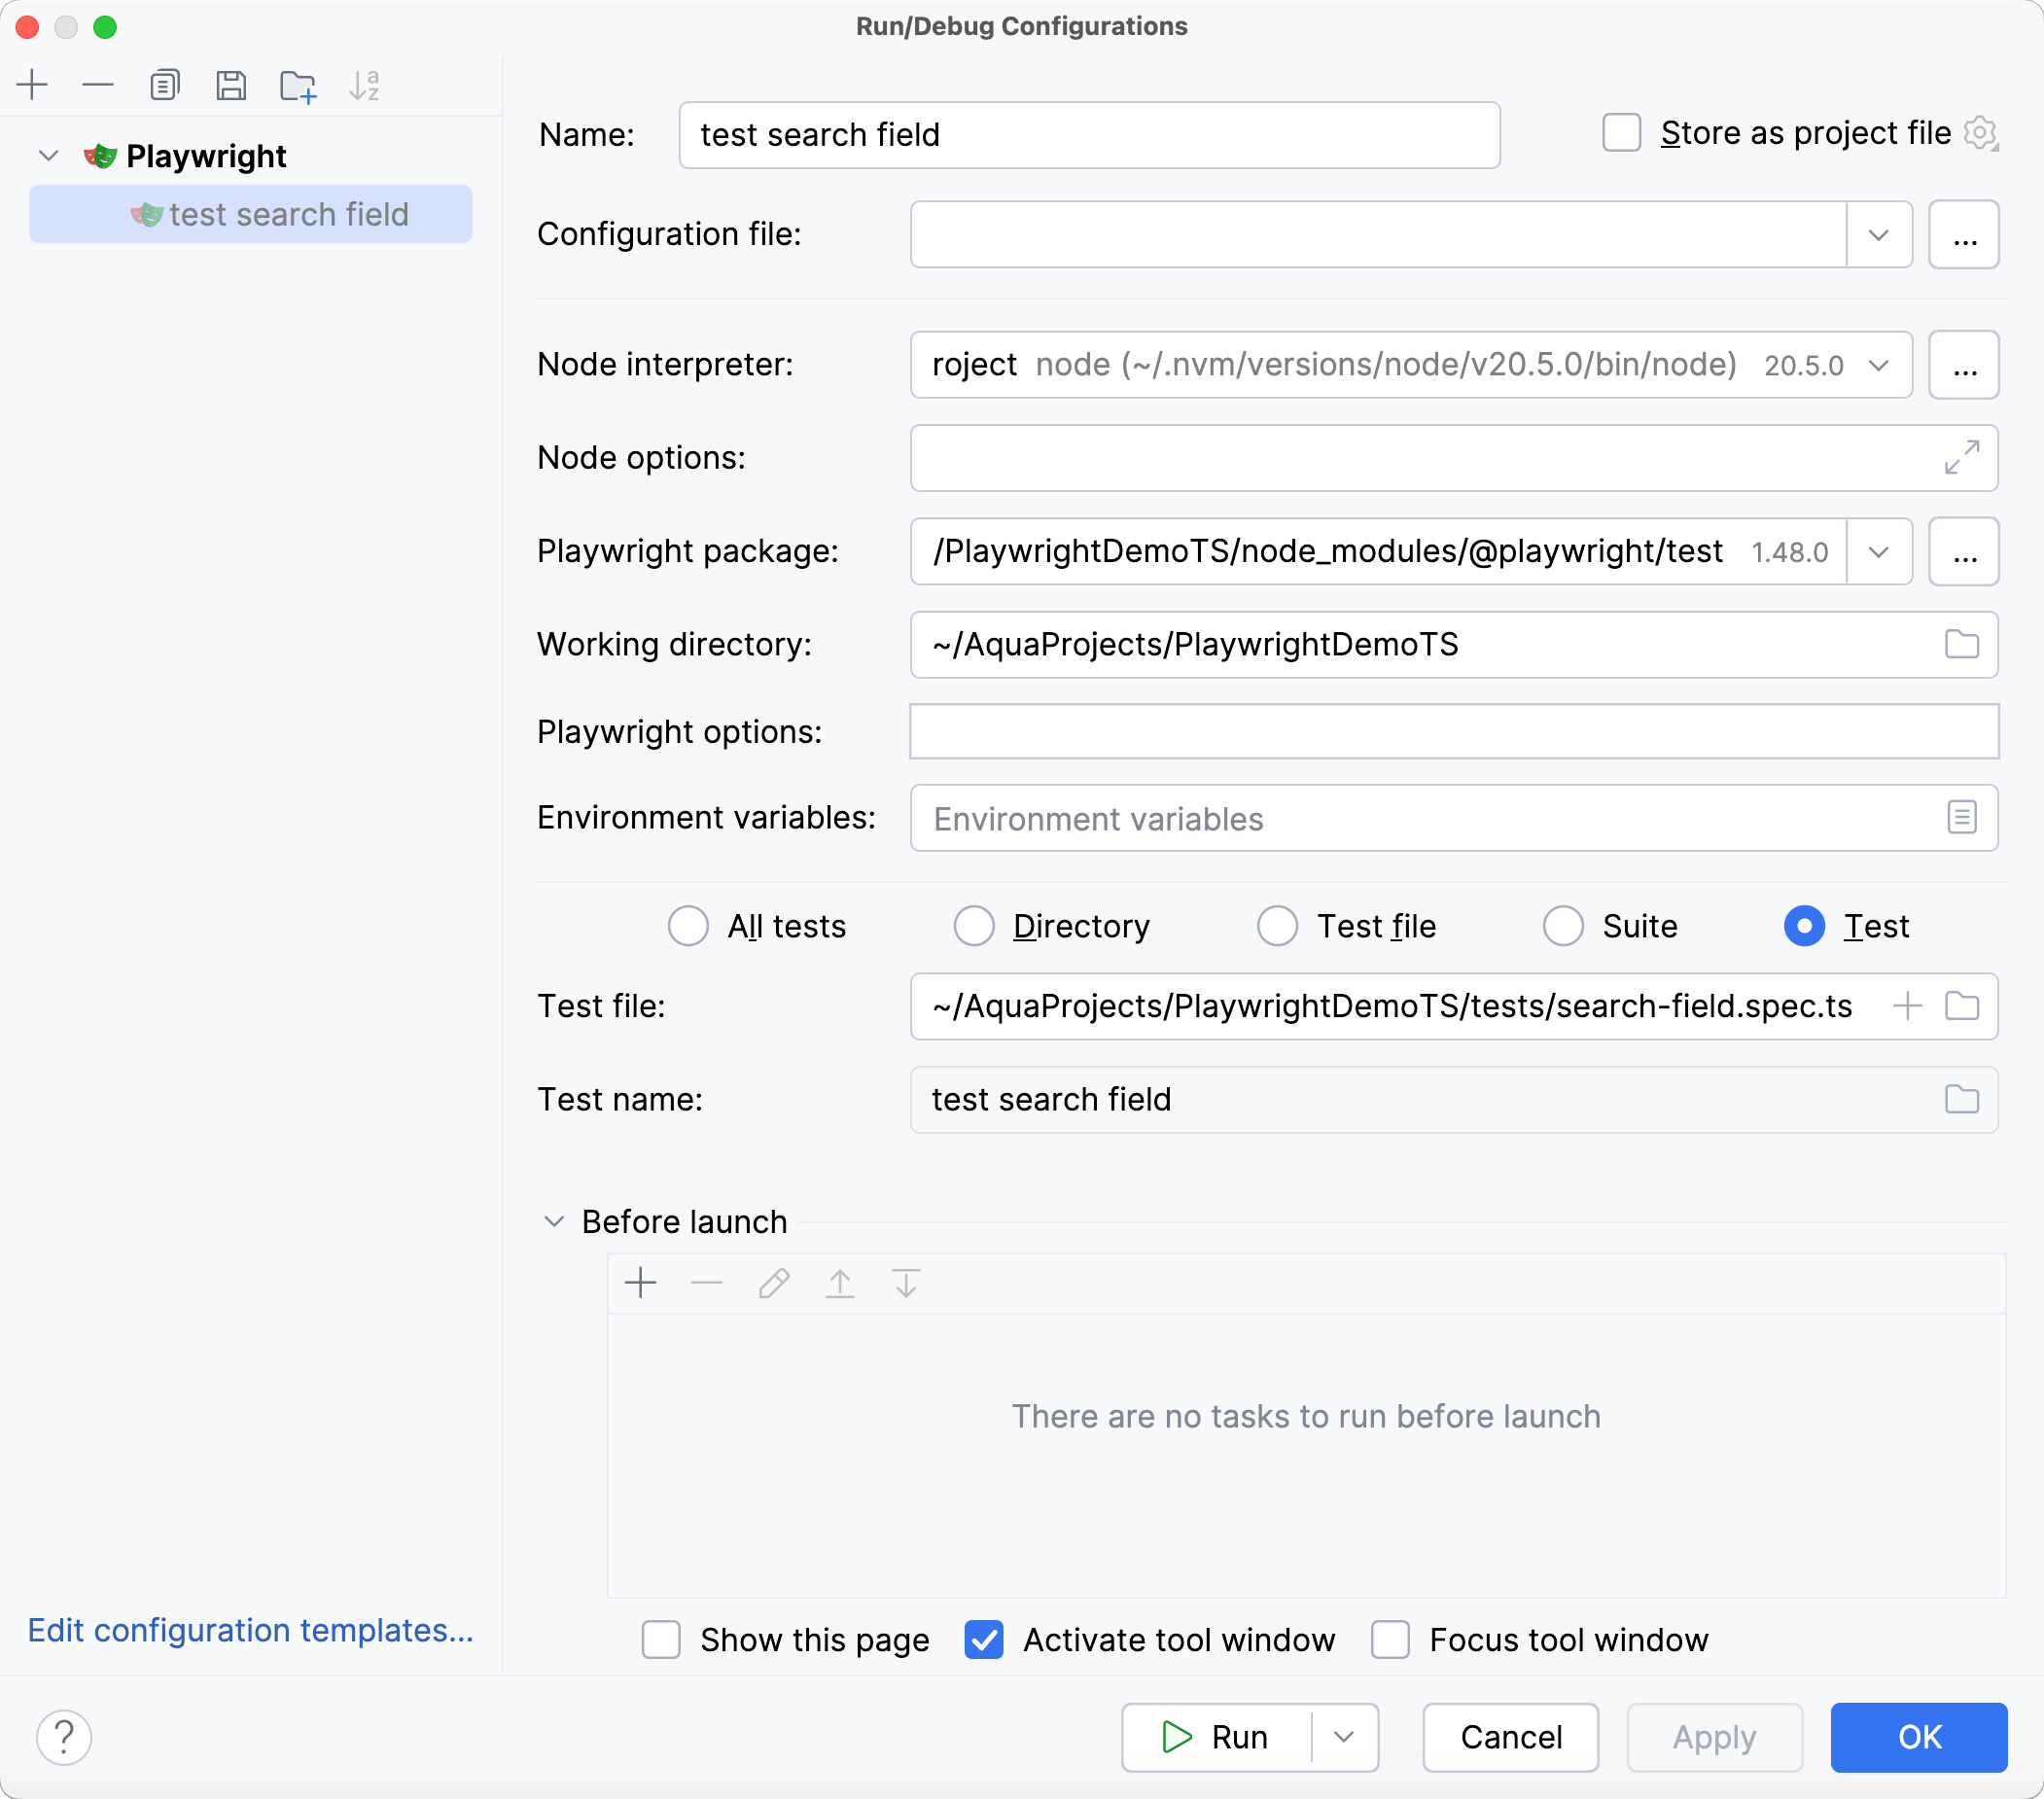
Run/debug configuration is a set of startup properties that define what to execute and what parameters and environment should be used during the execution.
You can create different sets of configurations for your tests and switch between them instantly, according to your needs.
Test execution details
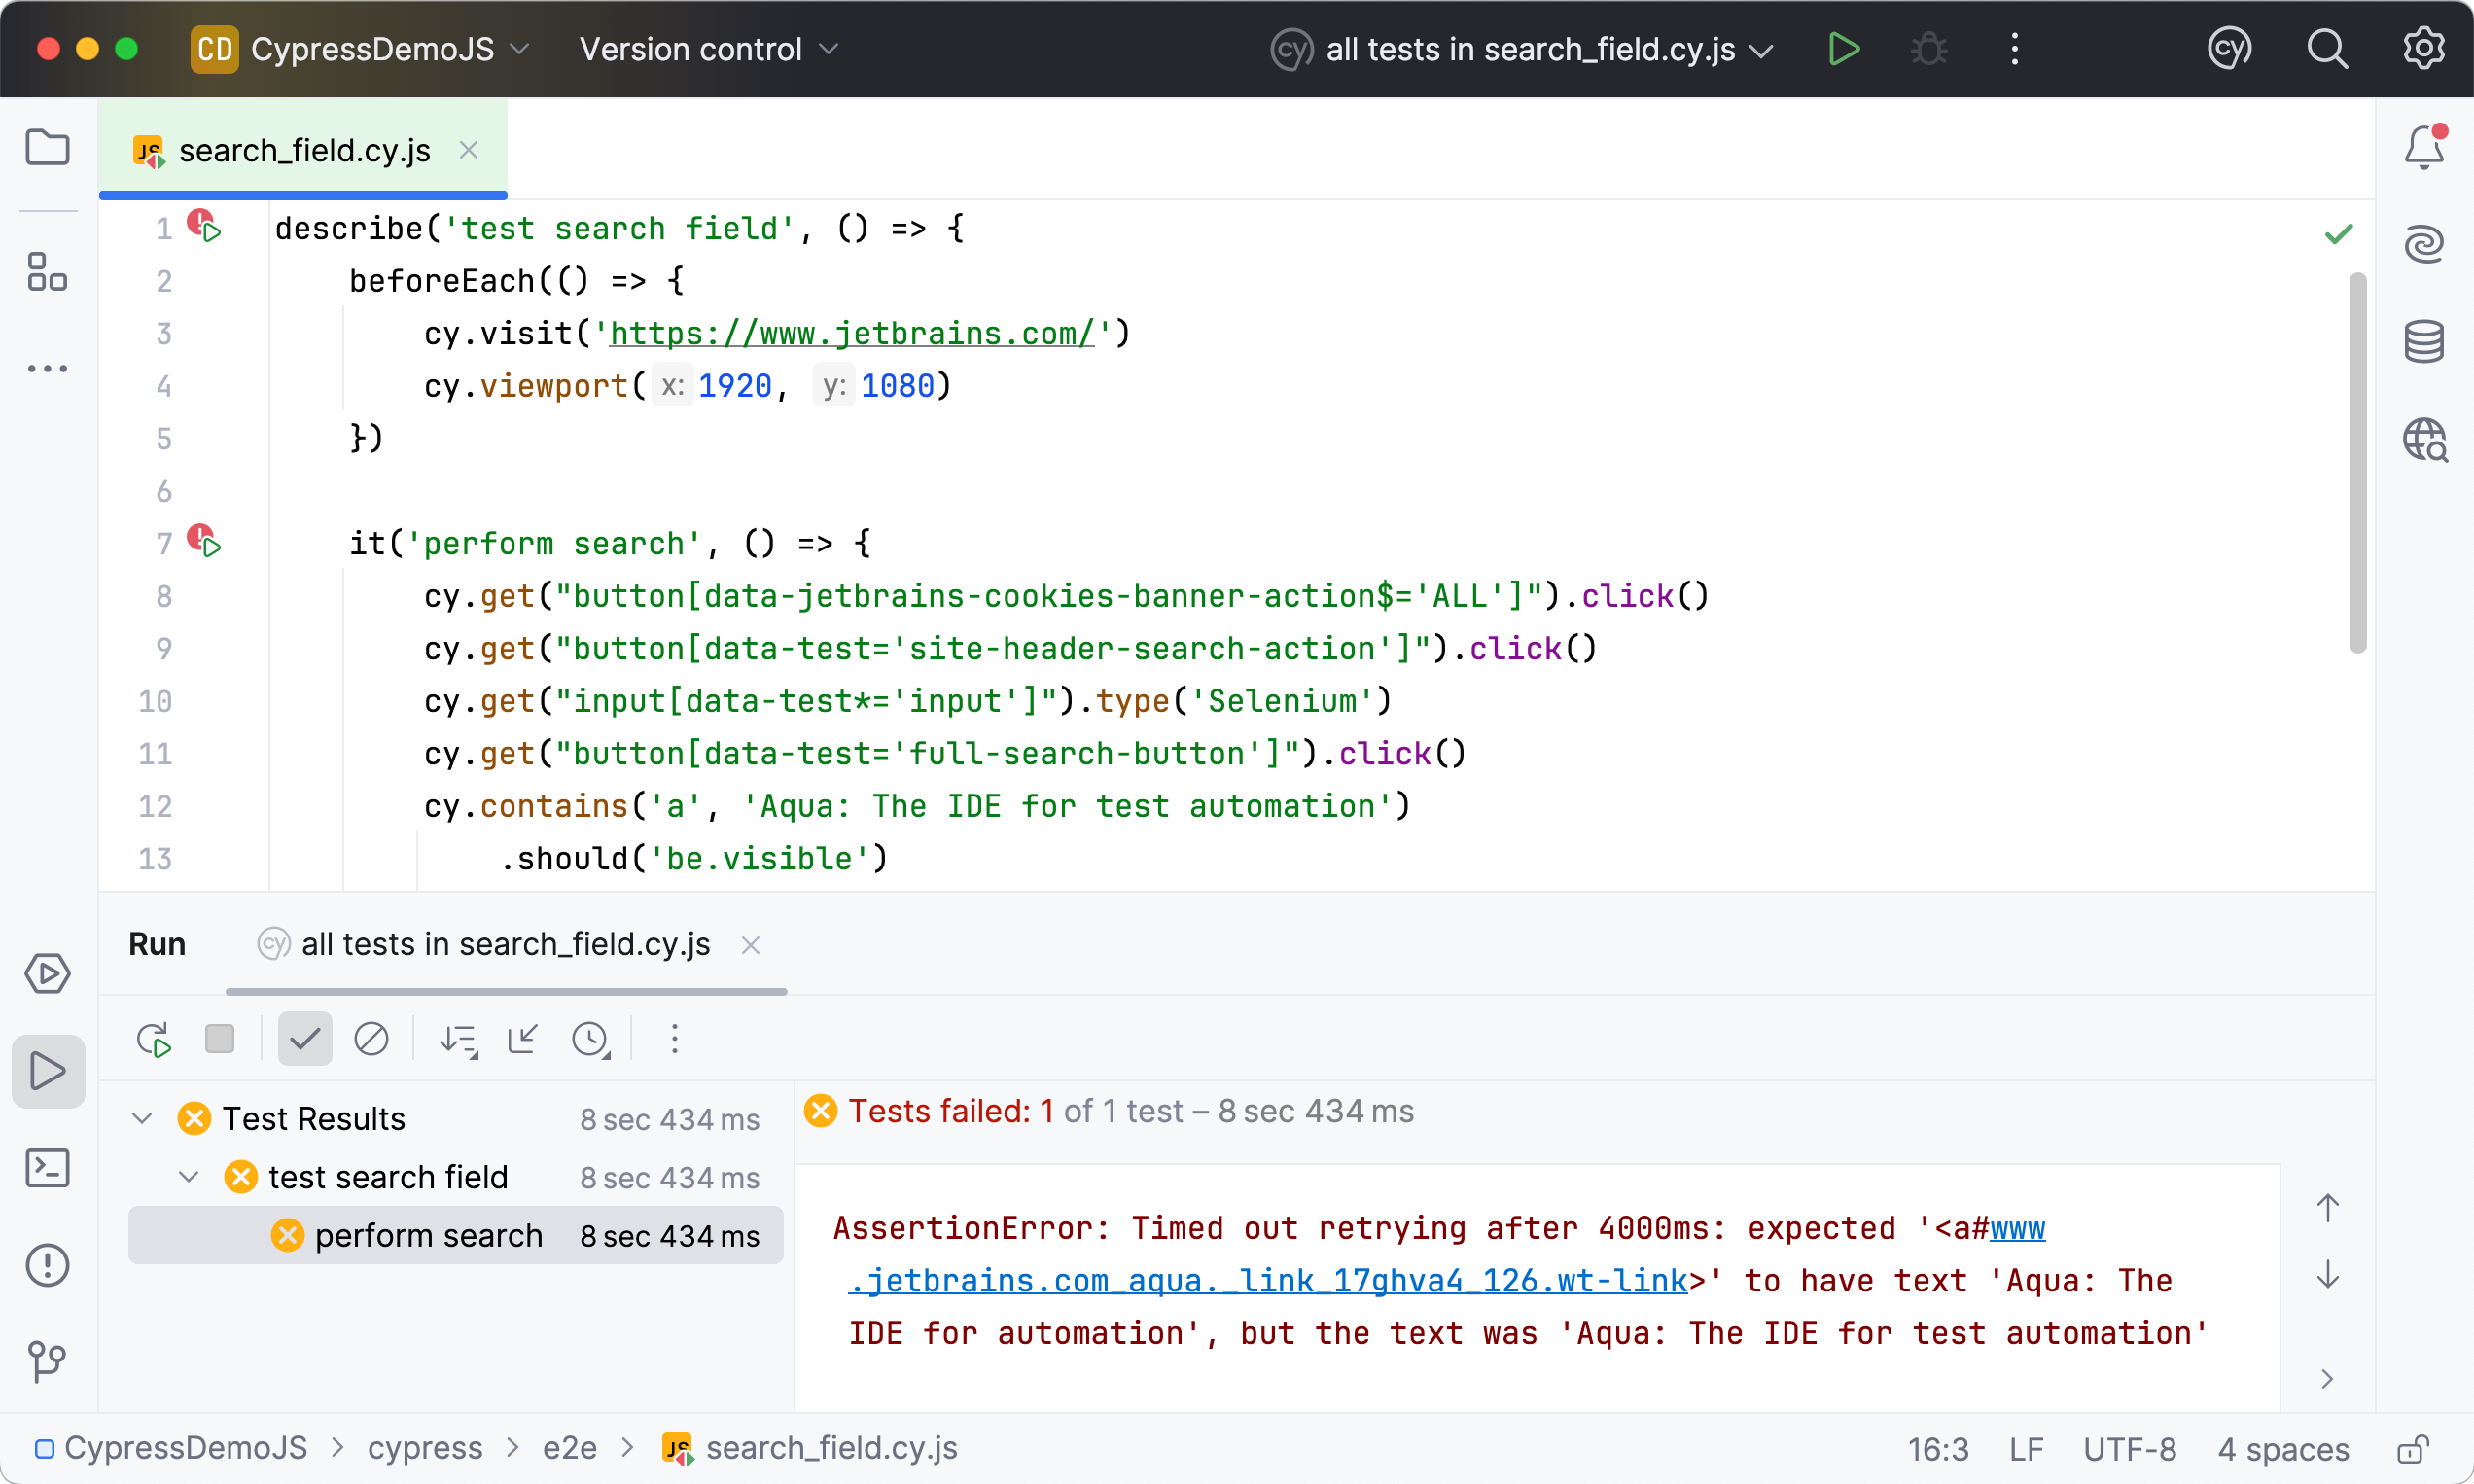
Once the tests finish running, you are provided with comprehensive results, including logs and console outputs for each test, so you can easily explore them. You can filter the results to quickly navigate through failed or ignored tests and analyze their execution times.
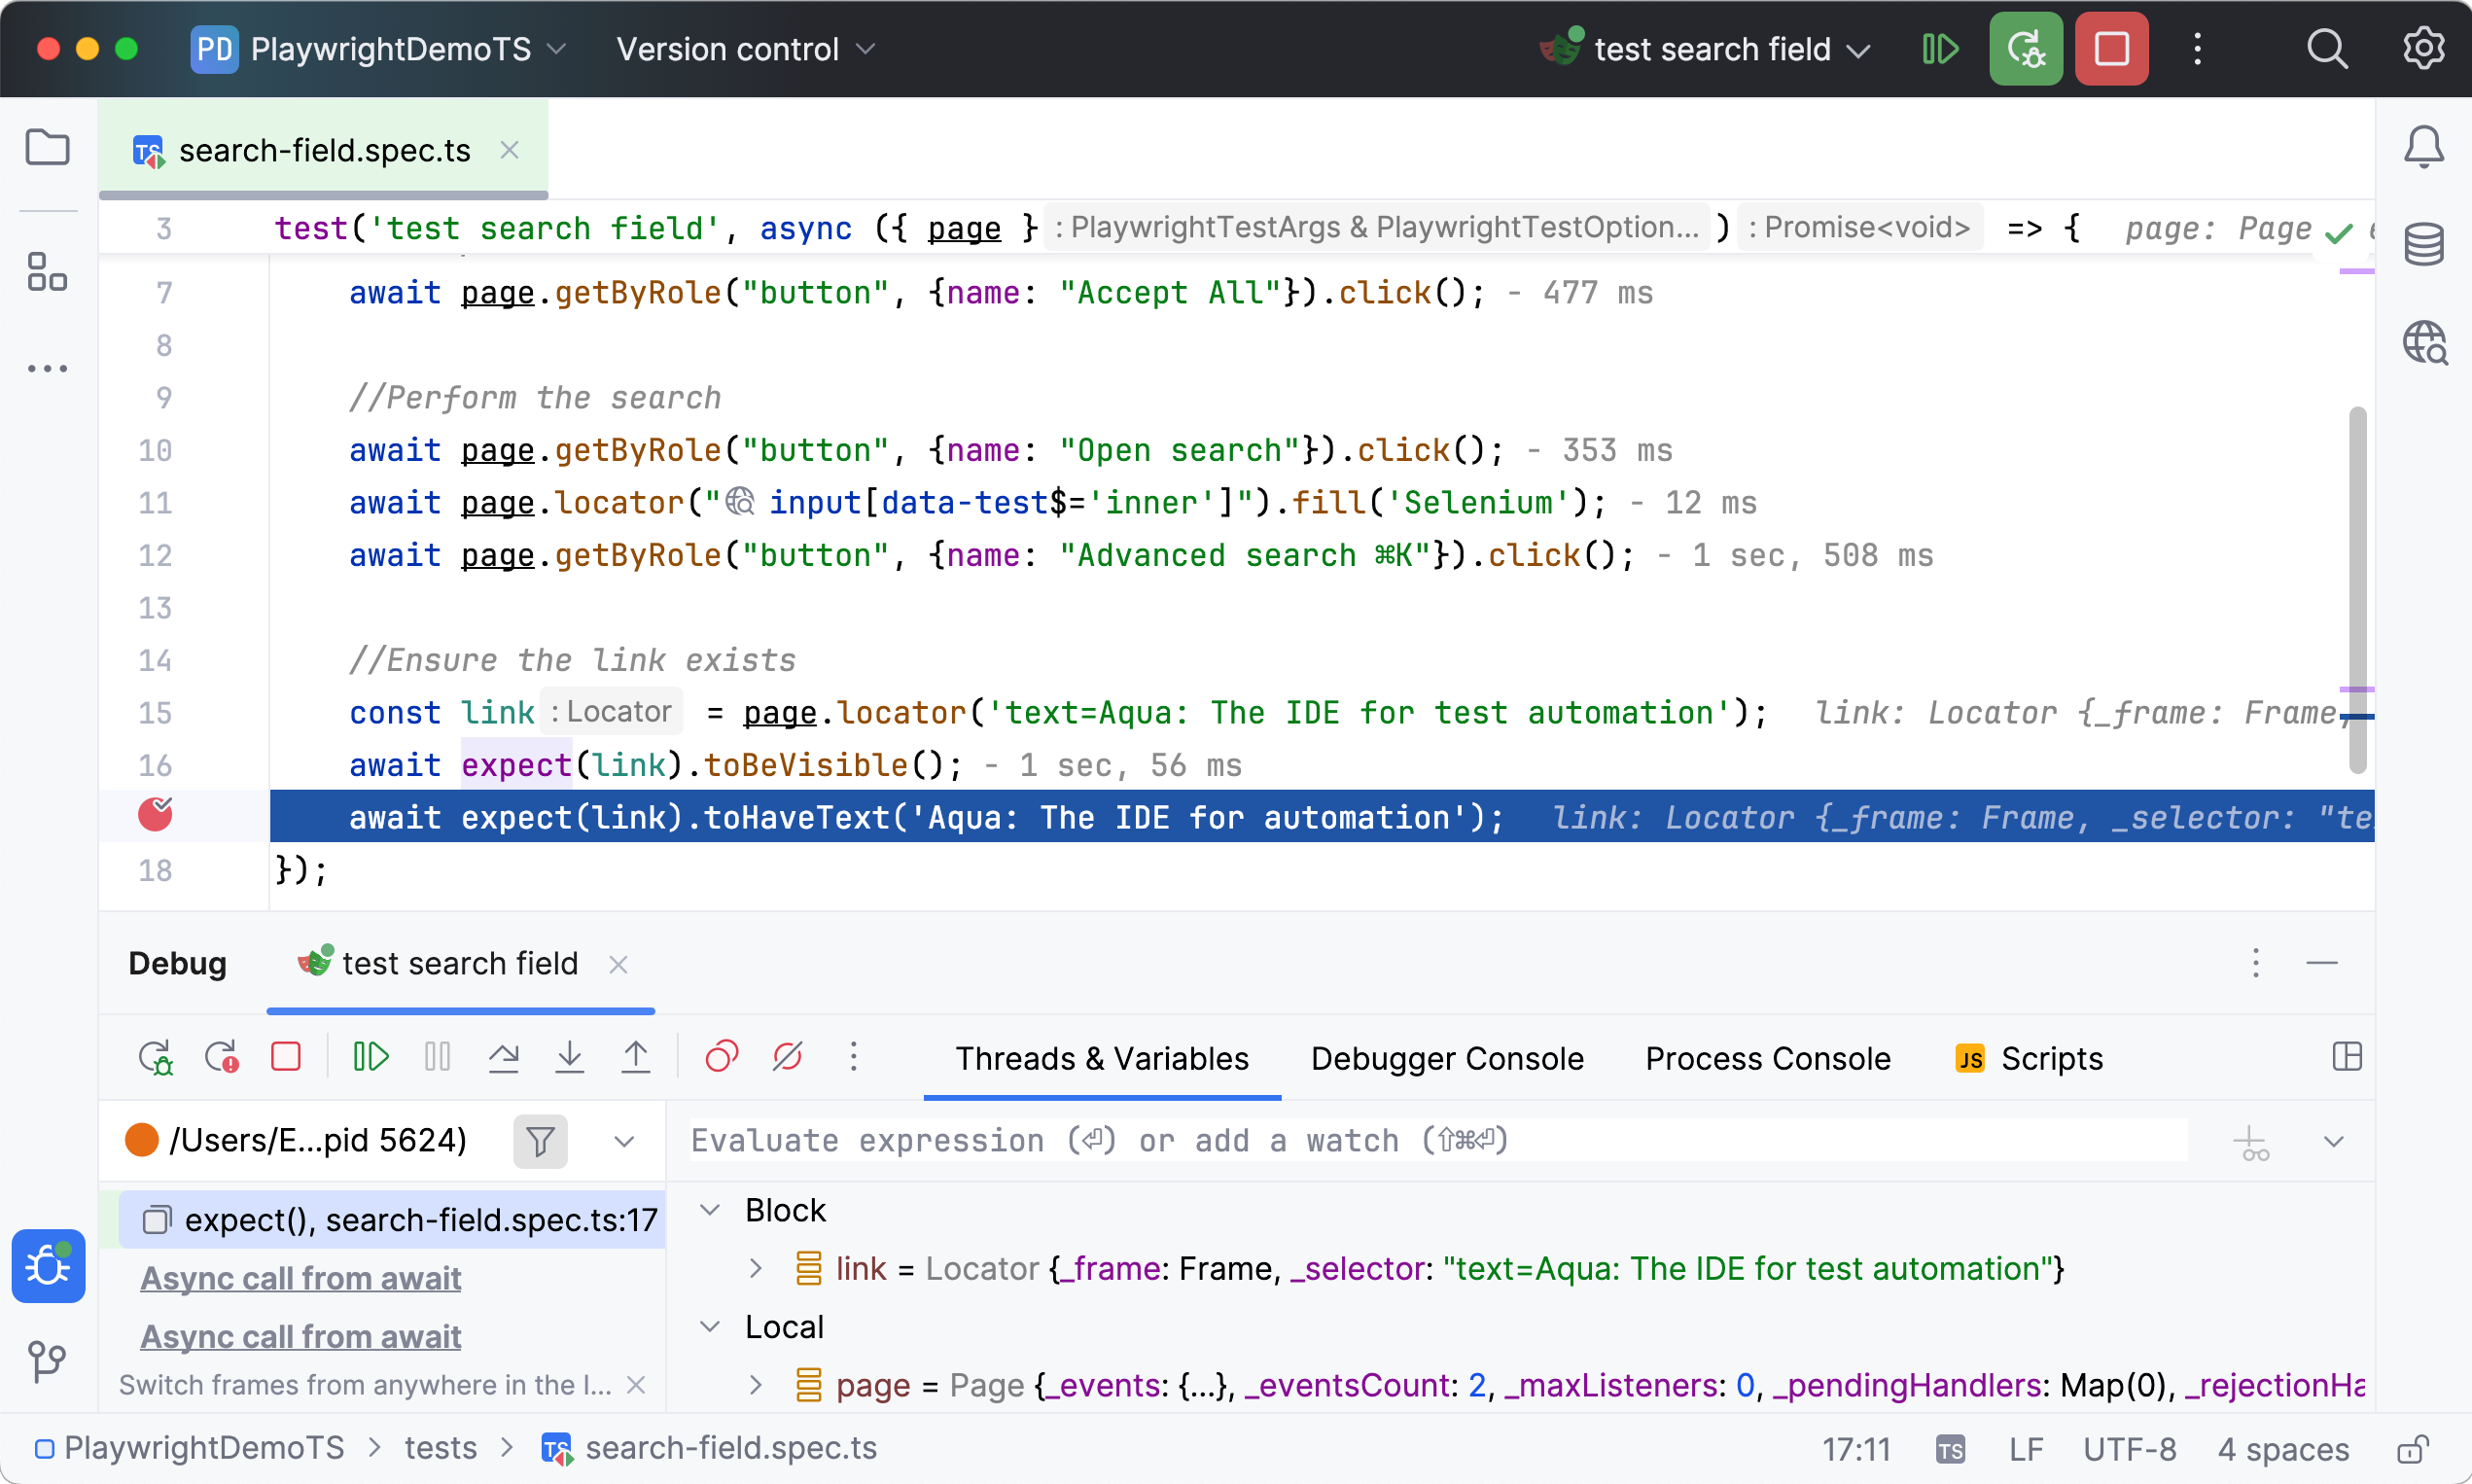
Debugger
A debugger is a tool used to test and troubleshoot code. It allows you to run the code step by step and provides you with the information on what happens during each step.
A debugger for Playwright tests is available out of the box. You can set breakpoints to pause execution and analyze the code.
