Cumulative Flow
Cumulative flow diagram (CFD) shows the distribution of cards by stages. For a kanban board or an unscheduled sprint, the chart is calculated for the last two weeks. For a scheduled sprint, the chart is calculated for the configured duration of the sprint. CFD is good for monitoring your progress, better understanding the workflow, and detecting bottlenecks. It is especially useful when you have a "Done" state to represent completed tasks. It may have other names, like "Fixed" for software bugs, or "Ready for shipment" for manufactured products.
To work with a cumulative flow diagram, you first need to set it up in the Chart tab of the board settings. After that, you can view the chart at any time by clicking the Charts icon in the toolbar.
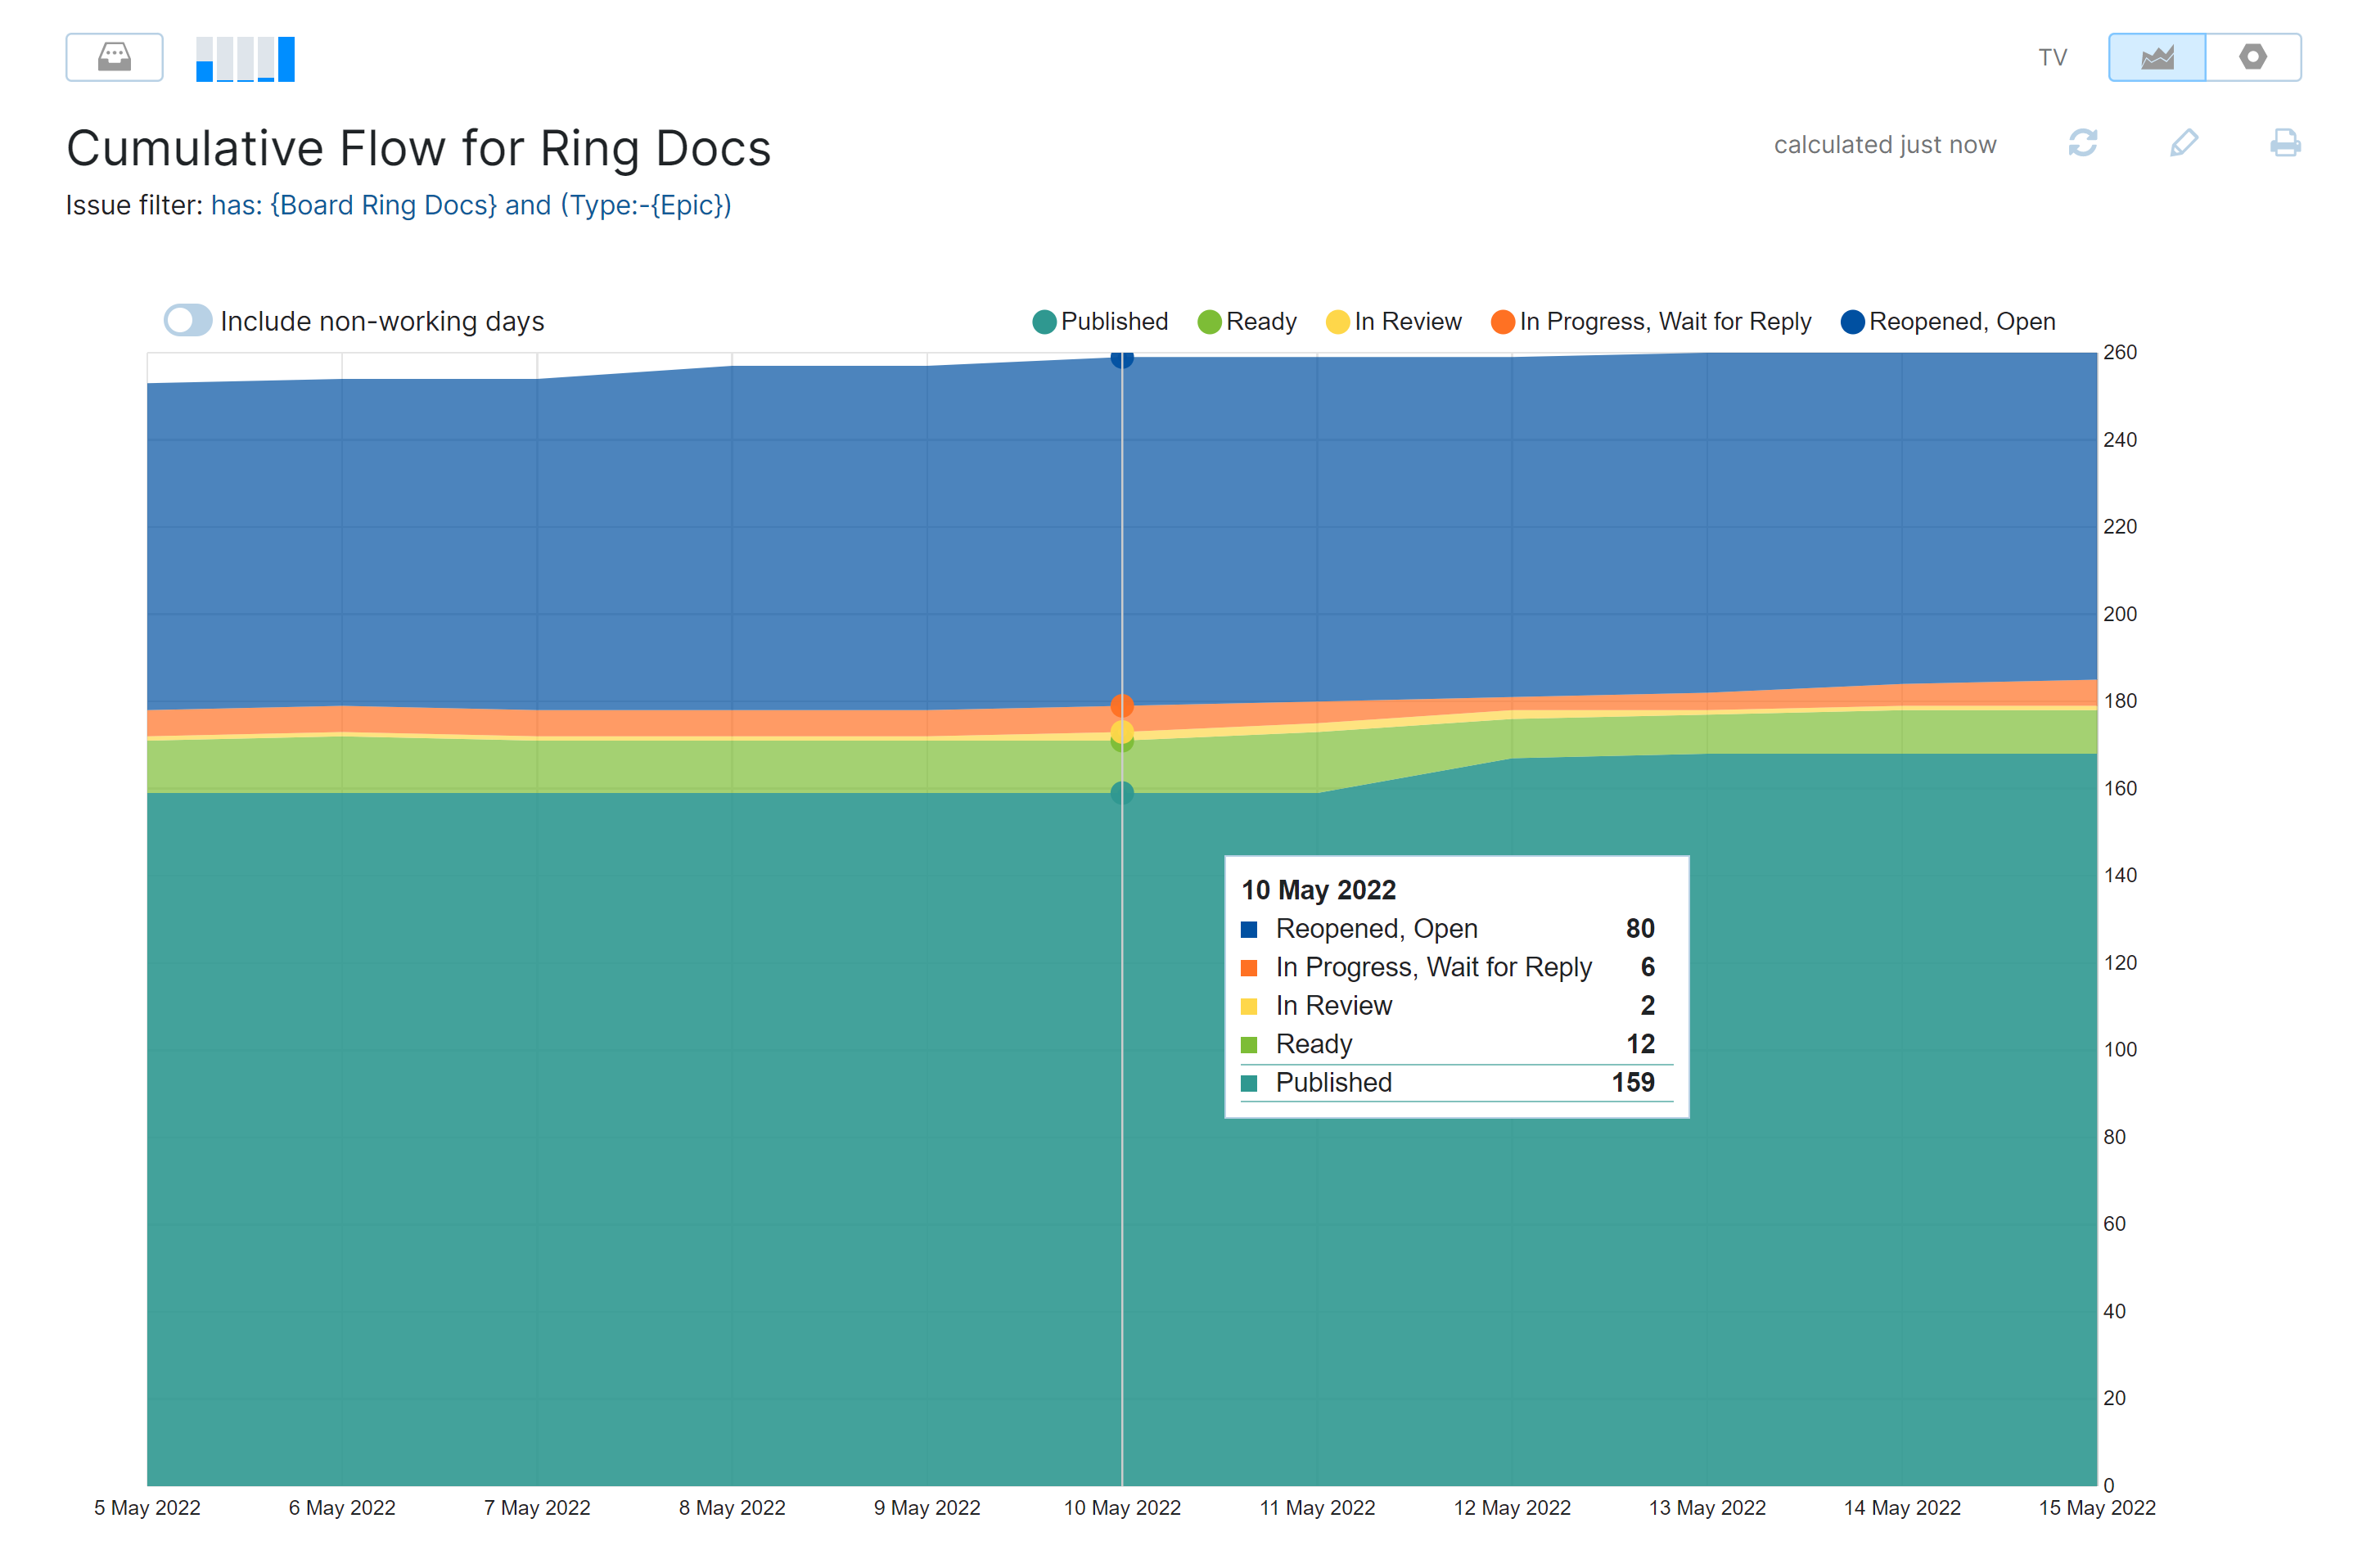
The cumulative flow diagram shows the distribution of cards in various stages of development with colors that represent the columns on the board.
To view the total number of cards that are assigned to each stage, move the pointer over a date in the chart.

On this graph, the vertical axis shows the number of cards, and the horizontal axis represents time (Each tick corresponds to the midnight of the pointed date).
If your team sticks to a fixed number of workdays each week, non-working days are shown as small plateaus that don't represent actual progress. To hide non-working days and focus exclusively on work-related activity, toggle this option off. The non-working days are defined in the system-wide Time tracking settings.
To see how quickly you are getting things done, look at the two regions between the Done area and the Open area. It represents your WIP. Basically, the steeper the angle at which it diminishes, the faster you are completing your workload and nearing the final release date.
Also, these two regions are supposed to shrink with time. If they are expanding, that could be a sign of a bottleneck. It can also mean that you are adding more work to your system than your current capacity allows.
By default, the chart is calculated by all the cards that are present on the board at the moment. You can also apply a search query to the chart to determine which cards, or even swimlanes, should be taken into account on the chart.
Open the Chart tab of the Board Settings. Alternatively, if you view a chart already, then you can click the
Edit button in the right-hand corner of the chart.
In the Issue Filter parameter, toggle to the Custom option.
In the displayed Query field, enter the desired search query.
Click the Recalculate button to apply the query and immediately re-draw the chart.