Agile Boards with Time Tracking
YouTrack lets you enter estimates for the amount of effort required to finish a task or develop a feature. In Scrum development, these estimates are commonly recorded in relative units that let teams measure the relative complexity of a task.
Some teams choose a different approach and estimate their efforts in intervals of real time. By logging the amount of time spent working on each issue, the team can measure how the actual work compares to their original estimation.
When you enable the Time Tracking feature, you can update and track these values on an agile board. This feature has its advantages no matter which type of agile practice you follow.
On a Scrum board, the estimations and spent time can be used to calculate the burndown for each sprint.
On a Kanban board, the total estimation and spent time show you how much work is currently allocated to each stage of development.
Time tracking is often used by agencies to monitor the amount of work performed for different clients. You can create separate agile boards and track spent time independently for each project or use dedicated swimlanes for different clients and track all of your work on a single board.
This tutorial shows you how to set up and use the Time Tracking feature on an agile board.
Configure Your Projects
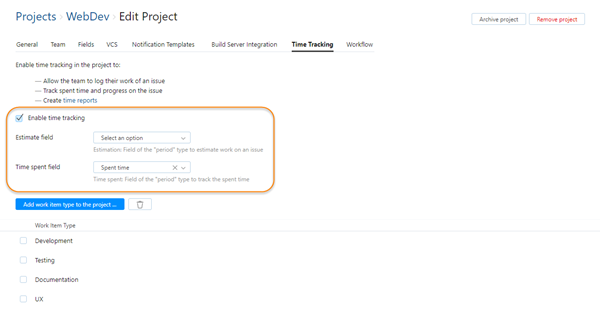
Before you can use the Time Tracking feature on an agile board, you must enable and configure the feature in each of the projects that are managed on the board. If you manage multiple projects on one agile board, all of the projects must use the same fields to store estimations and spent time.
To enable time tracking in a project:
For more information about tracking time in your projects, see Time Tracking Tutorial.
Configure Your Agile Board
The next step is to configure your agile board to display time tracking data. When configured, the board displays progress indicators for each column, swimlane, and card. You and your team can also update estimations directly on the board.
If you are using a Scrum board and want to track the progress for each sprint on a burndown chart, you can configure the board to calculate the burndown by spent time. For more information, see .
To configure time tracking on the agile board:
Track Estimation and Spent Time on the Board
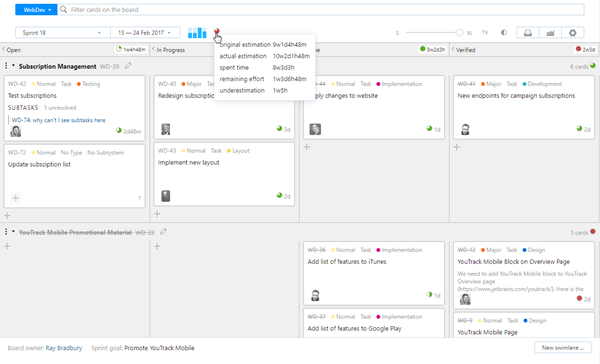
Time tracking data is displayed in a progress indicator. Each progress indicator compares the spent time to the estimation.
The amount of spent time that does not exceed the original estimation is drawn in green. The missing piece of the pie represents the amount of time that is left over.
When the spent time exceeds the original estimation, the progress indicator is drawn as a red circle.
The current status for each task is displayed as a progress indicator on the cards on the board. The aggregated status for all cards in a column is displayed in the column header.

If you use swimlanes, the agile board shows also the aggregated status for all cards in each swimlane. The aggregated status for all of the cards on the board is shown next to the sprint countdown in the toolbar.
The following calculations are shown in tooltips for single cards:
Value | Description |
|---|---|
estimation | The value that is entered in the estimation field for the task. |
spent time | The total amount of time that has been added to the issue in each work item. |
remaining effort | This value is shown when the estimation is less than the spent time. This value is calculated by subtracting the spent time value from the estimation value. |
The progress indicators for columns, swimlanes, and the board itself show aggregated data for the corresponding set of cards. The following calculations are show in tooltips that display aggregated data:
Value | Description |
|---|---|
original estimation | The sum of the values that are entered in the estimation field for each card. |
actual estimation | The original estimation plus the total amount of spent time that exceeds the original estimation for cards in an unresolved state. For cards in resolved states, the remaining effort is excluded from this calculation. |
spent time | The total amount of time that has been added to all of the cards in work items. |
remaining effort | This value is shown only when there are cards in unresolved states that have unspent estimations. This is the total amount of remaining effort for all of the cards in unresolved states. |
underestimation | This value is shown when the original estimation is less than the spent time. This is the total amount of spent time that exceeds the value in the estimation field for all cards. |
Update Time Tracking Data
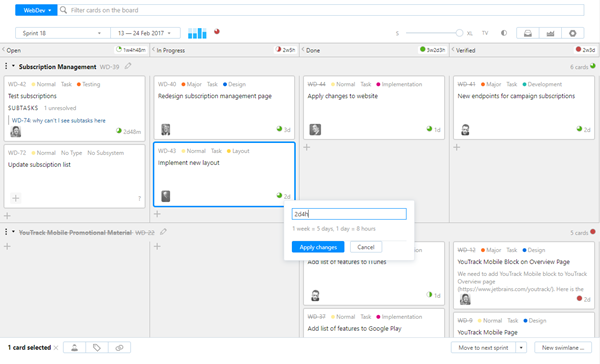
If you want to change the estimation value for an issue, you can update this field directly on the board. Click the Estimation link on a card and update the value in the dialog.

Spent time cannot be updated manually — only by adding or editing work items. You can add work items to issue on the board with a command. For more information, see Add Work Items.
For issues that are linked as the parent for other issues, YouTrack automatically calculates the estimation and spent time as the sum of values that are added to each subtask. If you created a project with the Scrum Project Template, pay careful attention when updating time tracking data. This project template creates two agile boards: one for development and another for project management.
The project management board tracks epics and user stories.
The project development board tracks user stories and tasks.
With this setup, you should only enter estimations and add work items to issues that are assigned the Task type. The estimation and spent time for each user story is calculated automatically based on the values that are assigned to each of its subtasks. Similarly, the estimation and spent time for each epic is calculated based on the calculated values that are assigned to its subtasks, the user stories.
If you enter an estimation value for an epic or user story, the automatic synchronization is broken and no longer reflects the estimation values that are assigned to each task. To restore the synchronization and calculate the estimation for the parent task automatically, set the estimation value in the parent task to the total estimation for each of of its subtasks.
Use the Burndown Chart
If you are not familiar with the basic concept behind the burndown chart, see Burndown Chart.
With time tracking enabled, you can calculate the burndown based on the spent time that is logged in each issue.
To calculate the burndown based on time spent:
Open the agile board and click the Board settings (
 ) button.
Select the Chart tab.
For Burndown calculated by, enable the Work items option.

Use the burndown chart to monitor your progress during the sprint.

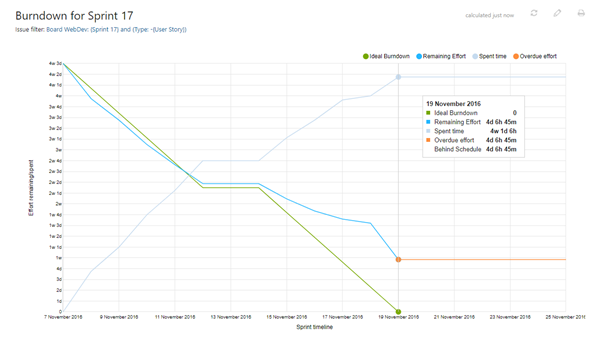
The burndown chart represents time tracking values on the line graph as follows:
Value | Description |
|---|---|
Ideal Burndown | The first value at the beginning of the timeline is the the total estimation value for the selected period. The line is drawn to the end of the timeline where the unfinished estimation is zero. Each point along the graph represents the amount of estimated time that is expected to be unspent each day in order to finish all tasks by the end of the selected period. The ideal burndown is not calculated for non-working days, which are represented by flat lines. |
Remaining Effort | Shows the actual unspent estimation in the issues that remain in an unresolved state for each day. This value is reduced by the total estimation for each issue that moves to a resolved state on that day. |
Ahead of/Behind Schedule | Displays the difference between the ideal burndown and the remaining effort. If the remaining effort is greater than the ideal burndown, the value is shown as behind schedule. If the ideal burndown is greater than the remaining effort, the value is shown as ahead of schedule. |
Spent Time | Shows the cumulative amount of spent time for each day. This value is calculated based on the amount of spent time that is added to issues in work items. The burndown chart only calculates spent time that is added as work items to the issues that are shown on the report. If you set up an agile board for epics as described in Agile Boards for Epics, the burndown chart for user stories doesn't show spent time. This is because the spent time for each user story is calculated based on the work items added to its underlying tasks. The user stories themselves don't have any work items. If you want to show spent time on a burndown chart for parent tasks, you need to add your work items to these issues instead of using time tracking for subtasks. You can add work items to both parent tasks and subtasks, but the spent time calculation for parent tasks is inflated. |
Overdue Effort | Displays the amount of remaining effort at the end of the sprint. |

