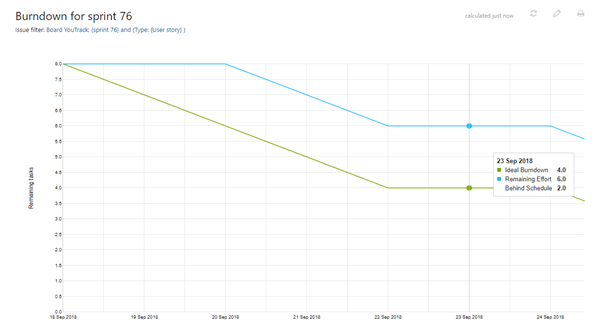
Burndown Chart #
A burndown chart compares ideal versus real effort remaining and can help indicate whether the team is on track for completing a sprint.
Burndown chart for a sprint in YouTrack basically follows the principles of Scrum burndown.
Ideal burndown — a line from the total sum of all cards' estimates to the zero estimates at the end time of the sprint.
Remaining effort — this line represents the actual amount of remaining estimates.
Spent time — this line is displayed only when time tracking is enabled for at least one project, which is associated with the current board. This graph shows the progress of actual time spent by the team and counts the duration of work items logged by the team for sprint tasks.
Configure the Burndown Chart #
To configure a burndown chart: #
Open the Chart tab of the Board Settings. Alternatively, if you view a chart already, then you can click the pencil (Edit) button in the right-hand corner of the chart.
For the Type parameter, toggle to the Burndown chart.
- In the Issue Filter parameter, select which cards should be counted for the chart:
All cards: all cards that are assigned to the current sprint of the board are taken into account. Please note that swimlanes are not taken into account in this case.
Custom: All cards and swimlanes that match the Query are taken into account. You can update the query at any time: Just open the settings and correct the query. When done, click the Recalculate button next to the Query filed to immediately see the updated chart.
- Define how the chart should be calculated. The availability of the options depend on the settings of the time tracking in the board projects:
Issue count: the chart is calculated by the number of cards.
- Estimation: calculate by the Estimation field of the board. When a card is resolved, the chart descends on the value of the Estimation field.
- Work items: calculated by the logged work items. Available only if:
All of the board projects have the same estimation field.
This field is used as the Estimation field for the board in the Card tab.
The estimation field is of the
periodtype.The time tracking is enabled and configured for at least one of the board projects.
periodtype), or let's say number of ideal days or story points (for theintegerorfloattypes), and so on.
How to Read Burndown Charts #
Remaining effort:The sum of effort left in cards.
When a task is added or removed to the sprint, the graph will move up/down respectively.
If the Burndown is calculated by parameter is set to Estimation, then when a card is resolved the graph descends the value of the estimation field that is set up for the board.
- If Time Tracking is enabled for at least one of the associated projects, then the graph is updated as follows:
Each time a work item is added to a card, the line descends the amount equal to the work item duration.
If the duration of the logged work item is greater than the remaining estimation for the card, then the line descends the value of the remaining estimation.
When a card is resolved, the line descends the value of the remaining estimation.
The Remaining Effort cannot descend lower than the zero point. So, if the spent time exceeds the estimated value, the line descends to the zero and afterwards follows along the time axis.
Spent time:Spent time is logged as the duration of work items for each card.
The Spent time graph displays the sum of all the logged work items as function of time.
Sample Burndown Chart #
The following sample burndown is calculated for a board without time tracking.
