Gantt Charts
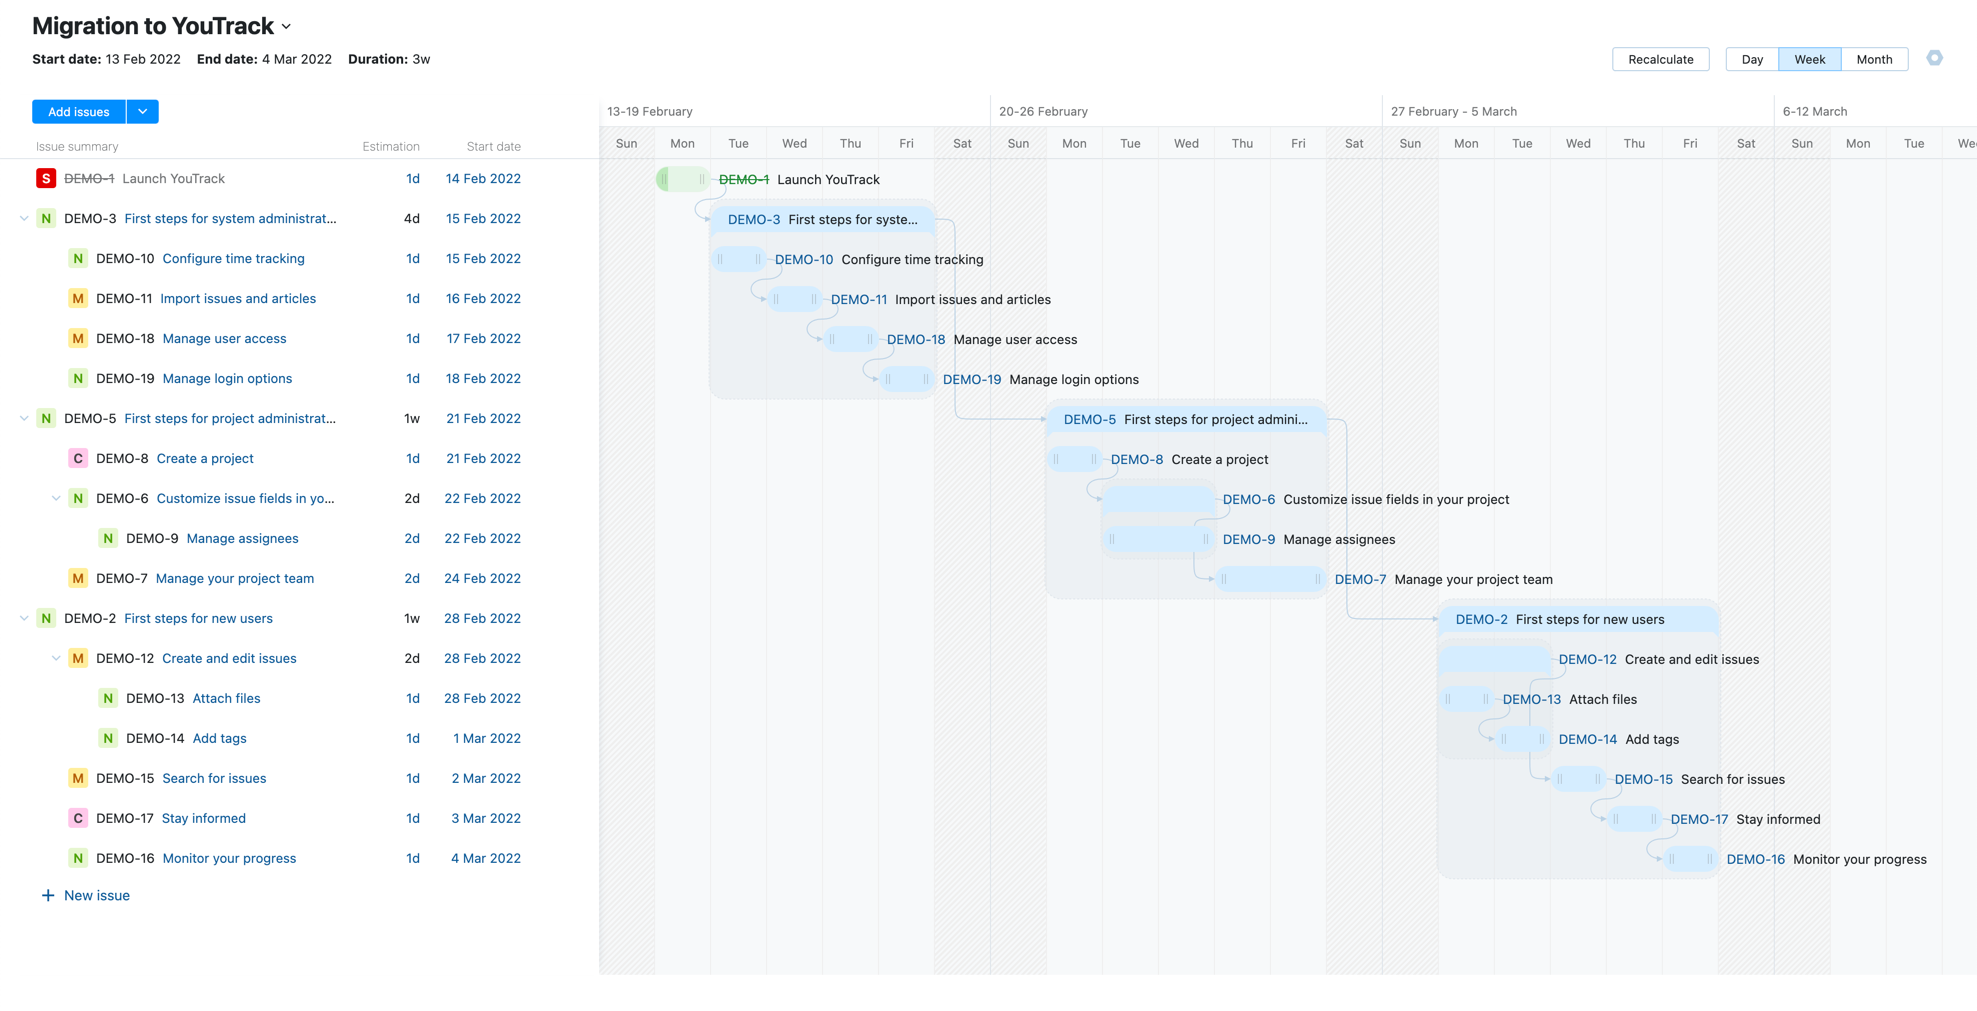
YouTrack's interactive Gantt charts let you create and update your project plans directly on a timeline. The Gantt chart lets you set up a list of tasks that are required for your project on the vertical axis, then use the horizontal timeline to determine when these activities should take place.

A Gantt chart also lets you:
Add and edit start dates for each task.
Set and view finish-to-start dependencies between tasks.
Track the relationship between parent tasks and their subtasks.
Enforce resource constraints that limit the number of issues that are scheduled simultaneously or ensure that tasks assigned to specific users are scheduled sequentially.
The interactive version of the Gantt chart is an alternative to the Gantt charts that are available as a report. The main difference between these two features is that the report is generated based on the underlying data that is stored in each issue. To update the chart and revise the timeline, you need to update each issue manually and recalculate the report. With the interactive version, you can update each issue in place without leaving the chart.
If you're currently working with a Gantt chart report, and would like to switch to the interactive version, you can transfer the data from an existing report to a new interactive chart. To learn more, see Migrate a Gantt Chart Report.
To learn how to set up your first Gantt chart, see Create and Use a Gantt Chart.
To explore some of the more advanced features that are available, see Configure a Gantt Chart.
For an overview of this feature, watch this short video.